U.S. ISM Manufacturing Index and U.S. Employment
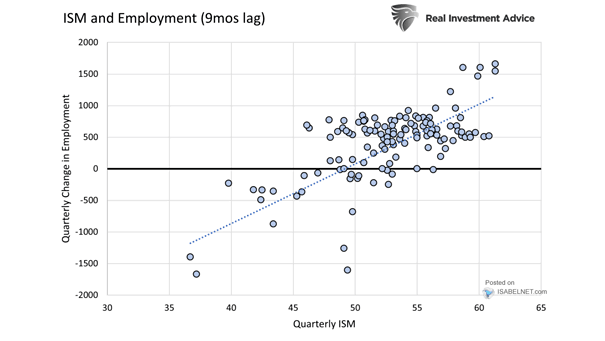
U.S. ISM Manufacturing Index and U.S. Employment It is important to keep a close eye on the U.S. ISM Manufacturing Index for any changes in U.S. employment.
U.S. ISM Manufacturing Index and U.S. Employment It is important to keep a close eye on the U.S. ISM Manufacturing Index for any changes in U.S. employment.
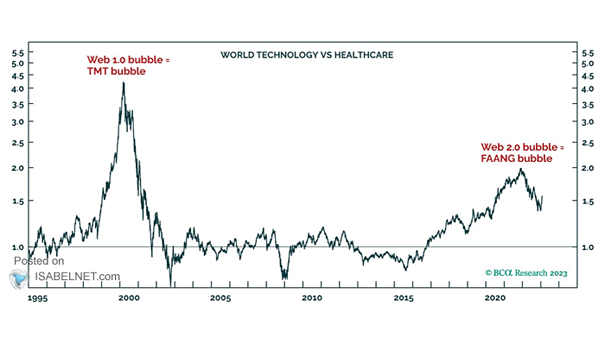
Performance – World Technology vs. Healthcare Is it the end of the FAANG bubble? Image: BCA Research
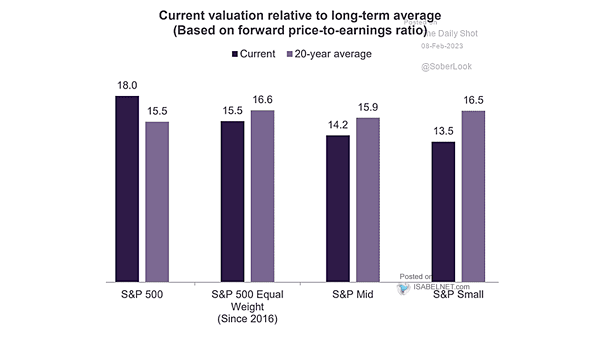
Current Valuation Relative to Long-term Average The S&P 500 Index remains historically expensive. Image: Truist
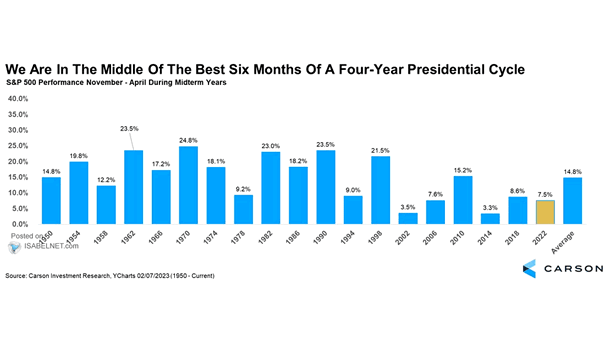
S&P 500 Performance November – April During Midterm Years Historically, the six months from November through April have seen the best performance for U.S. stocks following midterm elections. Image: Carson Investment Research
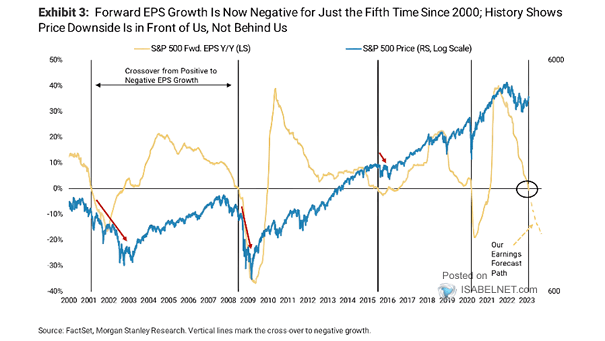
S&P 500 Forward EPS vs. S&P 500 Is there further downside ahead for the S&P 500, as an earnings recession is not priced into U.S. equities? Image: Morgan Stanley Research
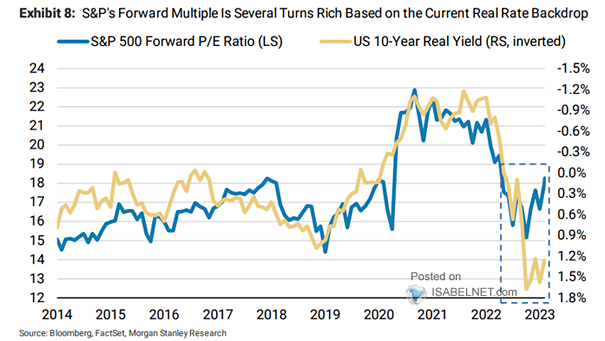
Valuation – 10-Year U.S. Treasury Real Yield vs. S&P 500 Forward Price/Earnings Ratio Despite higher real rates, the S&P 500’s valuation remains elevated. Image: Morgan Stanley Wealth Management
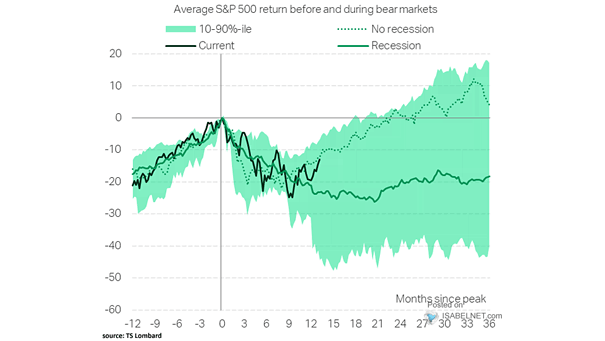
Average S&P 500 Return Before and During Bear Markets The S&P 500 does not price in a U.S. recession. Image: TS Lombard
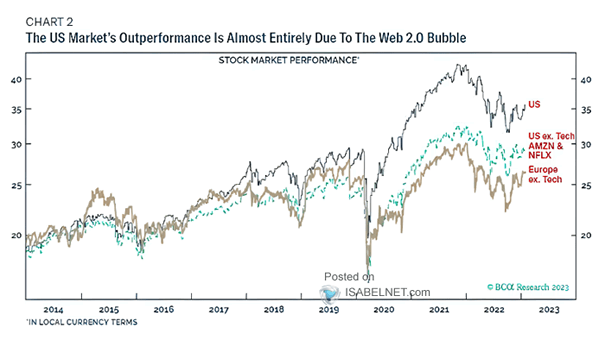
Stock Market Performance Is it the end of the web 2.0 bubble? Image: BCA Research
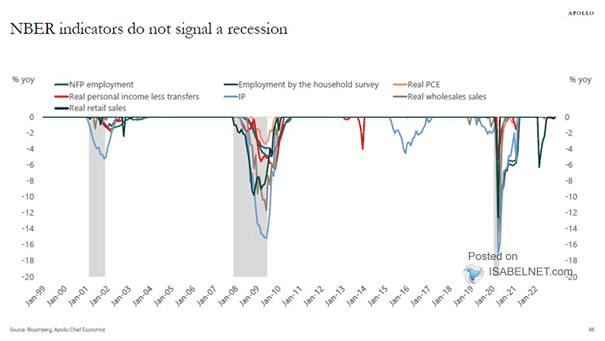
U.S. Recession – NBER Indicators The NBER indicators do not suggest that the U.S. economy is in recession at this time. Image: Apollo Global Management
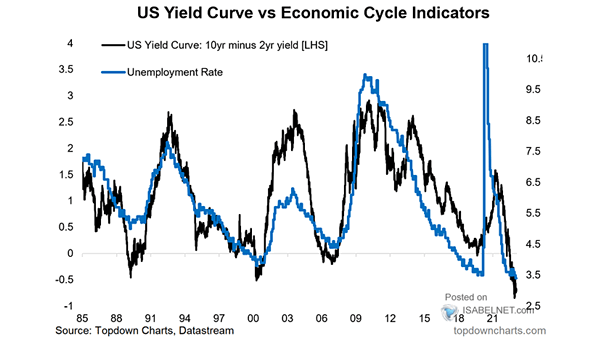
U.S. Unemployment Rate vs. U.S. 10Y-2Y Yield Curve A steepening U.S. yield curve has preceded recessions. Will the U.S. unemployment rate start to rise by the end of 2023? Image: Topdown Charts
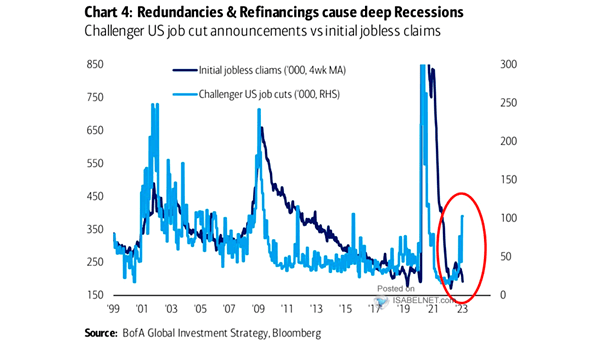
U.S. Labor Market – Challenger U.S. Job Cut Announcements vs. Initial Jobless Claims U.S. job cuts are rising. Does it look like a soft landing at first? Image: BofA Global Investment Strategy