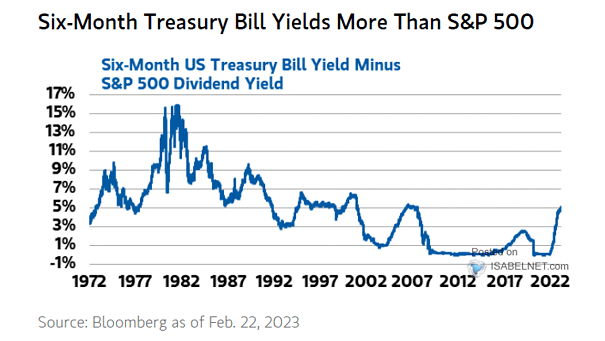
Six-Month U.S. Treasury Bill Yield Minus S&P 500 Dividend Yield
Six-Month U.S. Treasury Bill Yield Minus S&P 500 Dividend Yield Should investors favor U.S. T-bills over the S&P 500 dividend yield? Image: Morgan Stanley Wealth Management
Six-Month U.S. Treasury Bill Yield Minus S&P 500 Dividend Yield Should investors favor U.S. T-bills over the S&P 500 dividend yield? Image: Morgan Stanley Wealth Management
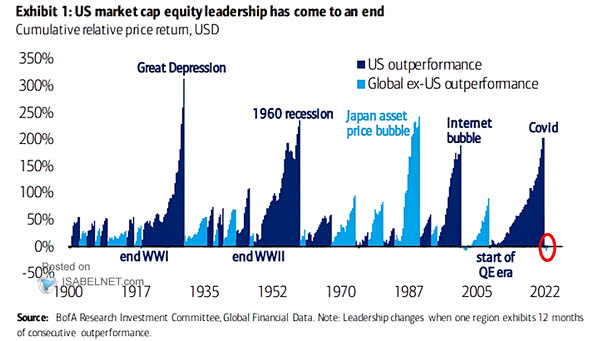
Performance – U.S. Outperformance vs. Global Ex-U.S. Outperformance Should U.S. investors favor international equities over U.S. equities? Image: BofA Research Investment Committee
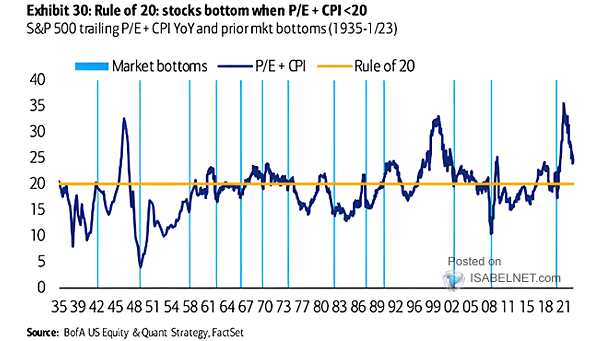
S&P 500 Trailing P/E + CPI YoY and Prior Market Bottoms Historically, U.S. stocks bottomed when the S&P 500 trailing P/E + CPI was below 20. Image: BofA US Equity & Quant Strategy
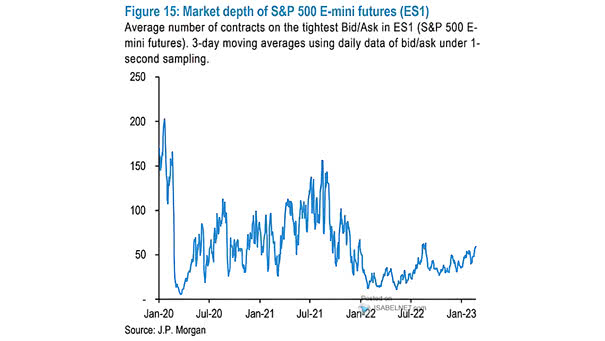
Liquidity – Market Depth of S&P 500 E-mini Futures U.S. equity market depth has been steadly improving. Image: J.P. Morgan
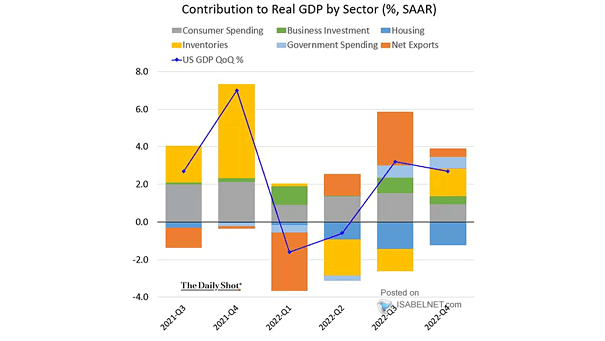
Contribution to U.S. Real GDP by Sector U.S. GDP grew 2.7% in Q4 2022. The housing slump was a net drag on GDP, and it’s not over yet. Image: The Daily Shot
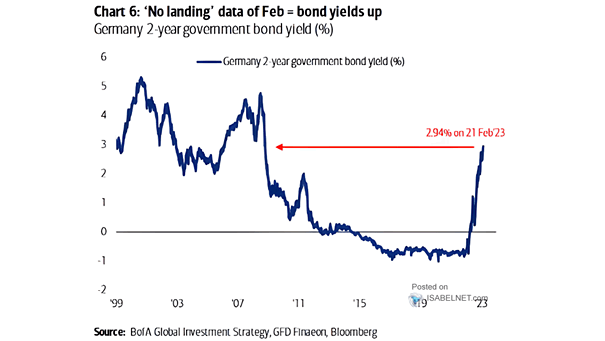
Germany 2-Year Government Bond Yield The German 2-year government bond yield, considered to be the most sensitive to European Central Bank (ECB) policy rate expectations, hit a 14-year high. Image: BofA Global Investment Strategy
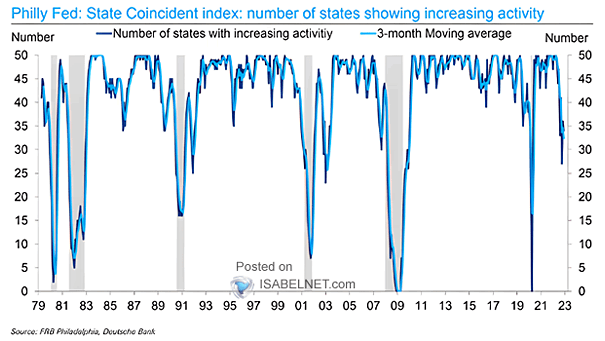
U.S. Recession – Number of States with Increasing Activity The odds of a U.S. recession in 2023 appear high. Image: Deutsche Bank
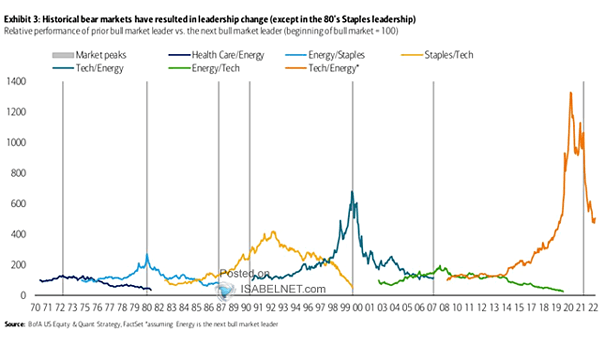
Relative Performance of Prior Bull Market Leader vs. The Next Bull Market Leader Should investors continue to overweight the energy sector over the tech sector? Image: BofA US Equity & Quant Strategy
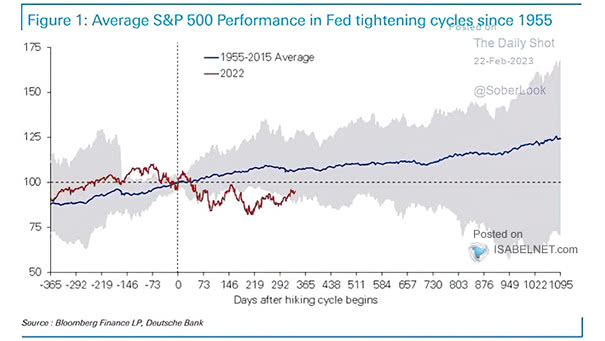
Average S&P 500 Performance in Fed Tightening Cycles S&P 500 weakness tends to materialise 9-10 months after the first Fed rate hike and tends to last a year. Image: Deutsche Bank
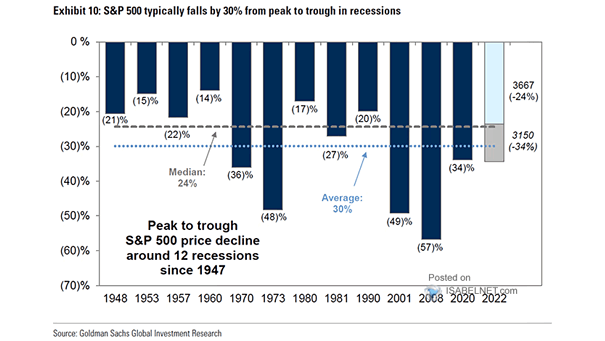
Peak to Trough S&P 500 Price Decline Around Recessions Could the S&P 500 fall more than 30% from peak to trough in a hard landing scenario? Image: Goldman Sachs Global Investment Research
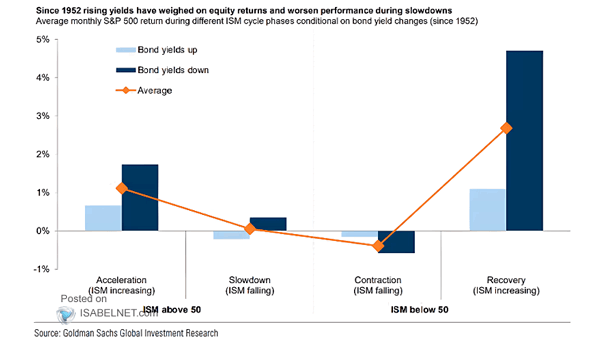
Average Monthly S&P 500 Return During Different ISM Cycle Phases Conditional on Bond Yield Changes Historically, rising bond yields are a headwind for U.S. equity returns. Image: Goldman Sachs Global Investment Research