U.S. LEI vs. U.S. GDP and Recessions
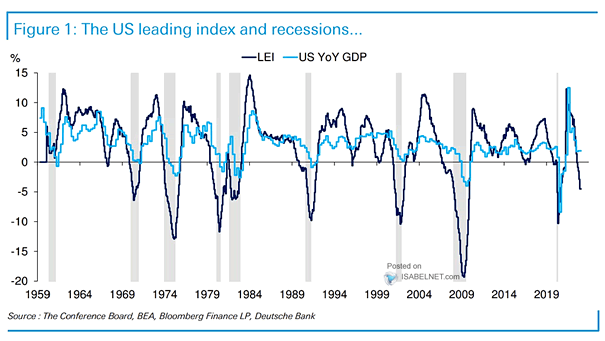
U.S. LEI vs. U.S. GDP and Recessions Should investors bet on a hard or soft landing for the U.S. economy? Image: Deutsche Bank
U.S. LEI vs. U.S. GDP and Recessions Should investors bet on a hard or soft landing for the U.S. economy? Image: Deutsche Bank
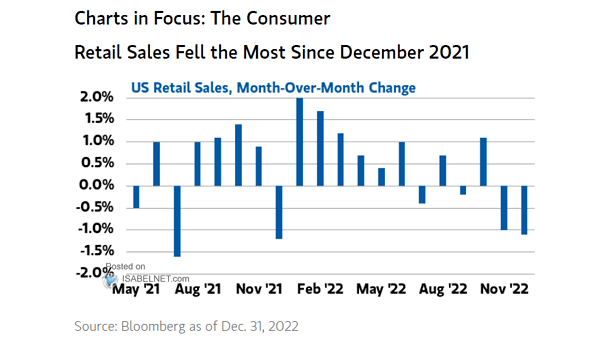
U.S. Retail Sales Recent U.S. retail sales data shows that there is a slowdown in consumer spending, which can have a detrimental effect on the U.S. economy. Image: Morgan Stanley Wealth Management
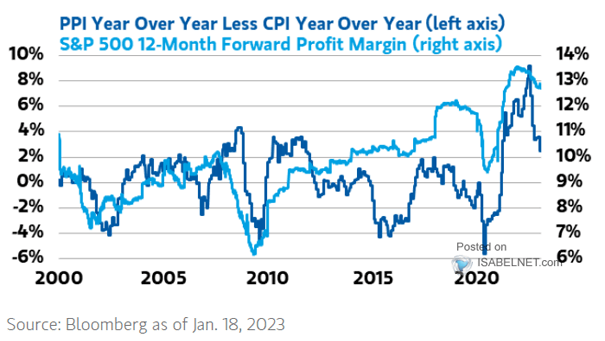
U.S. PPI Less U.S. CPI vs. S&P 500 12-Month Forward Profit Margin Are margins at risk, as they tend to be correlated with the spread between PPI and CPI? Image: Morgan Stanley Wealth Management
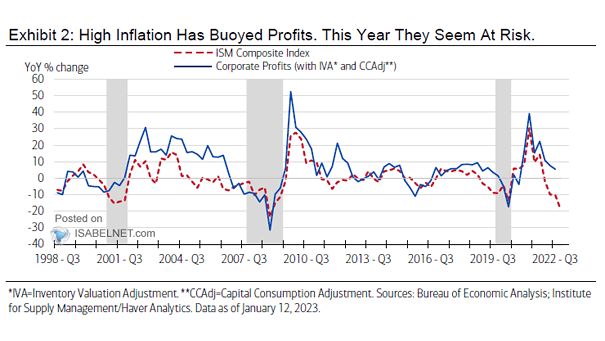
ISM Composite Index vs. Corporate Profits The decline in the ISM Composite Index indicates a weakening of the U.S. economy, which could lead to lower corporate profits. Image: Merrill Lynch Wealth Management
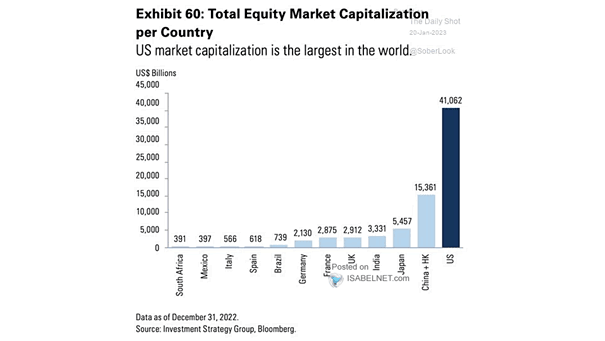
Total Equity Market Capitalization per Country The United States has the largest equity market capitalization in the world (over $41 trillion as of December 31, 2022). Image: Goldman Sachs Global Investment Research
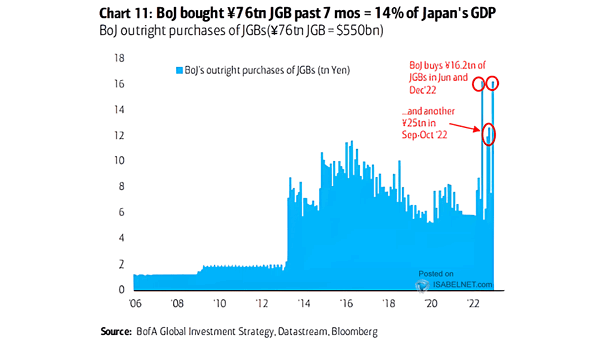
Central Bank – BOJ Outright Purchases of JGBs Will the Bank of Japan (BOJ) continue to buy Japanese government bonds as part of its yield curve control policy? Image: BofA Global Investment Strategy
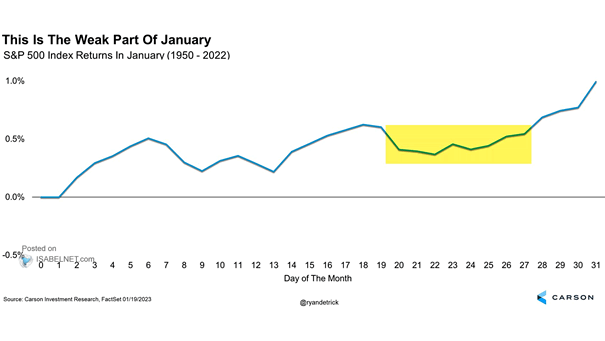
S&P 500 Index Returns in January Historically, the S&P 500 tends to accelerate higher in late January. Image: Carson Investment Research
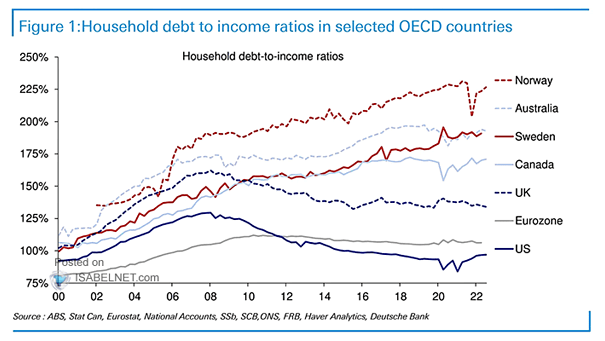
Household Debt-to-Income Ratios U.S. households have improved their balance sheets in the past decade. Image: Deutsche Bank
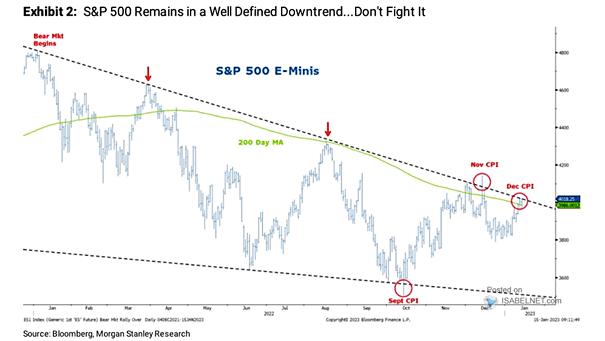
S&P 500 E-Minis Morgan Stanley remains bearish on the S&P 500. Image: Morgan Stanley Research
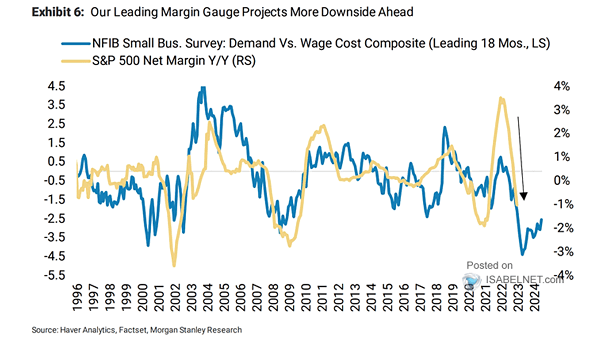
S&P 500 Net Margin and NFIB Small Business Survey: Demand vs. Wage Cost Composite (Leading Indicator) Is there a risk of further decline in S&P 500 margins? Image: Morgan Stanley Research
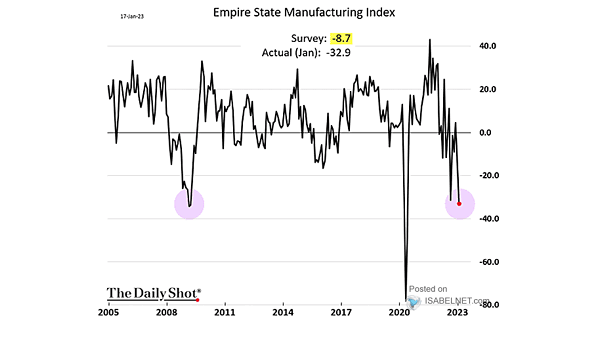
Empire State Manufacturing Index The plunge in the Empire State Manufacturing Index is not good news. Image: The Daily Shot