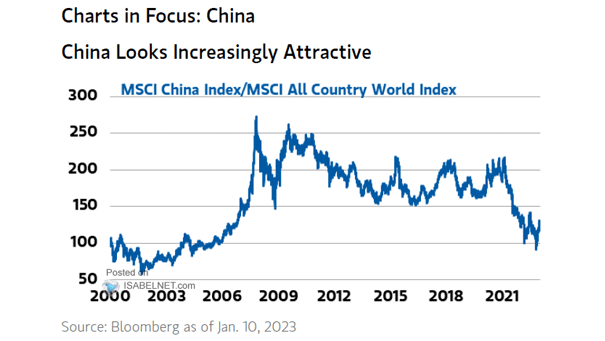
Equity – MSCI China Index / MSCI All Country World Index
Equity – MSCI China Index / MSCI All Country World Index Should investors overweight Chinese stocks? Image: Morgan Stanley Wealth Management
Equity – MSCI China Index / MSCI All Country World Index Should investors overweight Chinese stocks? Image: Morgan Stanley Wealth Management
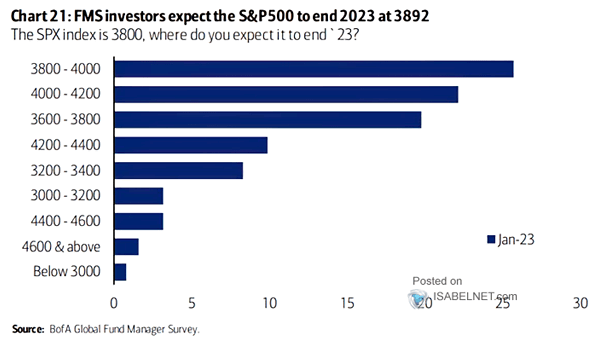
FMS Investors – Where Do You Expect the S&P 500 Index to End the Year? FMS investors are not bullish on the S&P 500 this year. Image: BofA Global Fund Manager Survey
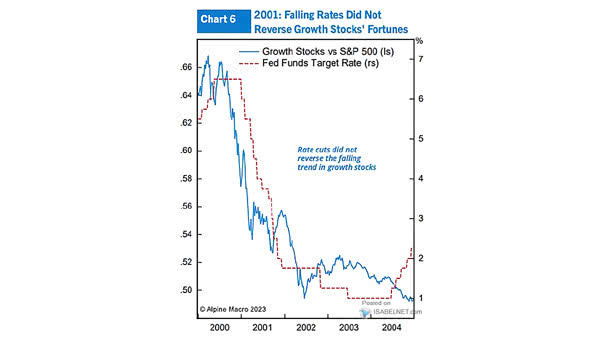
Growth Stocks vs. S&P 500 and Fed Funds Target Rate Will growth stocks underperform the S&P 500 in 2023? Image: Alpine Macro
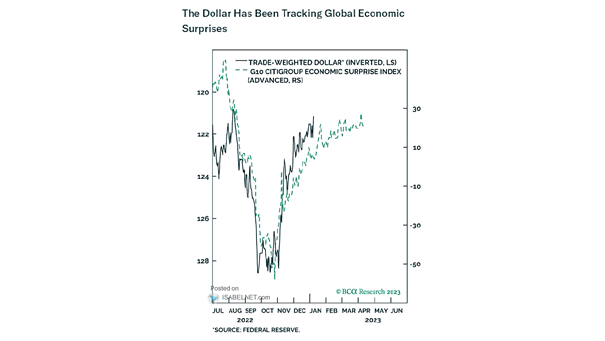
Trade-Weighted Dollar vs. G10 Citigroup Economic Surprise Index Will the U.S. dollar trend weaker in 2023? Image: BCA Research
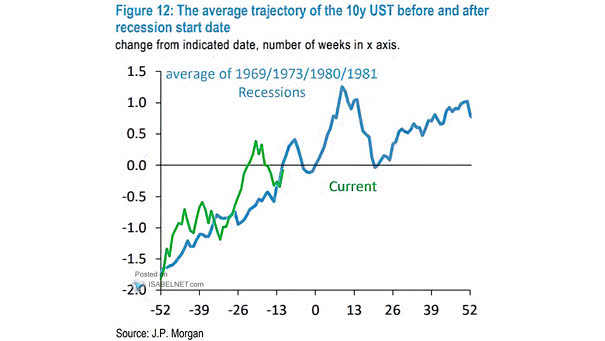
The Average Trajectory of the 10-Year U.S. Treasury Yield Before and After Recession Start If a U.S. recession occurs in 2023, will the 10-year U.S. Treasury yield rise? Image: J.P. Morgan
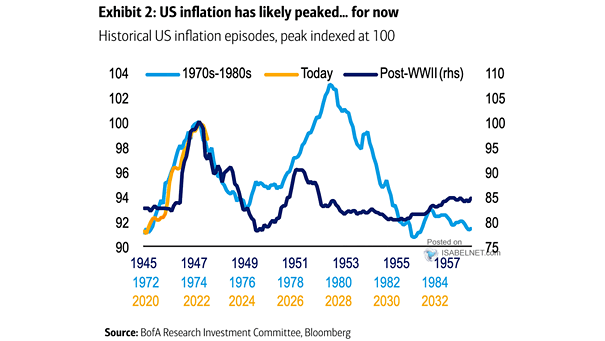
Historical U.S. Inflation Episodes Is it the last U.S. inflation peak of this cycle? Image: BofA Research Investment Committee
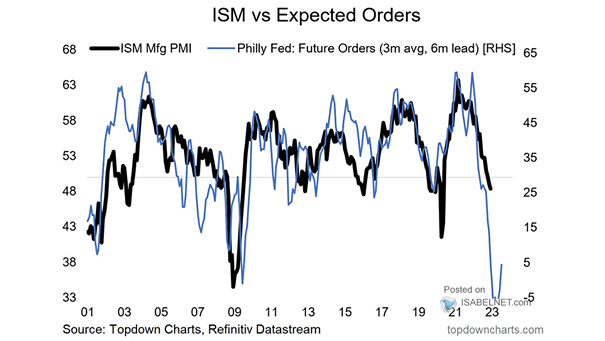
U.S. ISM Manufacturing PMI vs. Philly Fed Futures Orders (Leading Indicator) Will the ISM Manufacturing PMI fall further, as a recession is looming in the United States? Image: Topdown Charts
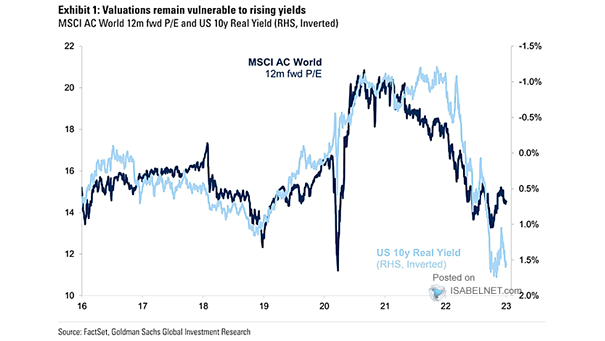
Valuation – MSCI AC World 12-Month Forward P/E and 10-Year Real U.S. Treasury Yield 10-year U.S. real yields help explain the valuation of global equities. Image: Goldman Sachs Global Investment Research
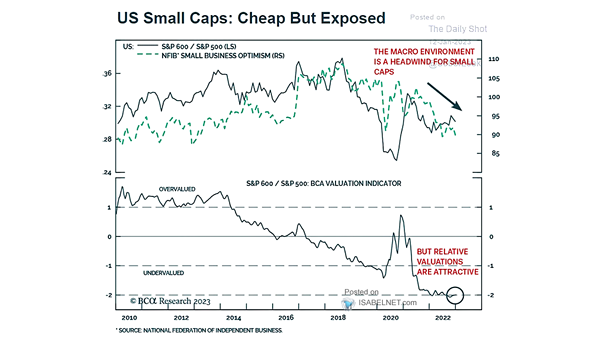
U.S. Small Cap Stocks – S&P 600 / S&P 500 U.S. small business confidence is deteriorating, which does not bode well for U.S. small-caps, but relative valuations remain attractive. Image: BCA Research
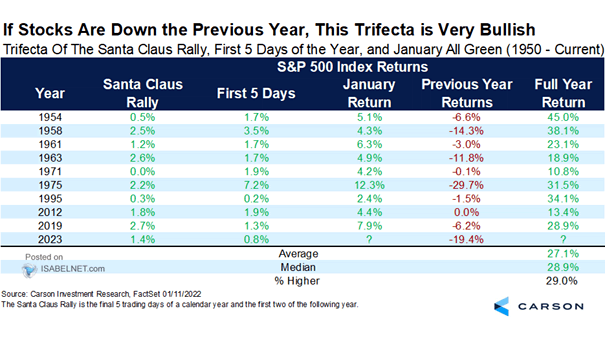
S&P 500 – Trifecta of the Santa Claus Rally, First 5 Days of the Year, and January All Green Could the S&P 500 end the year higher with a double-digit gain? Image: Carson Investment Research
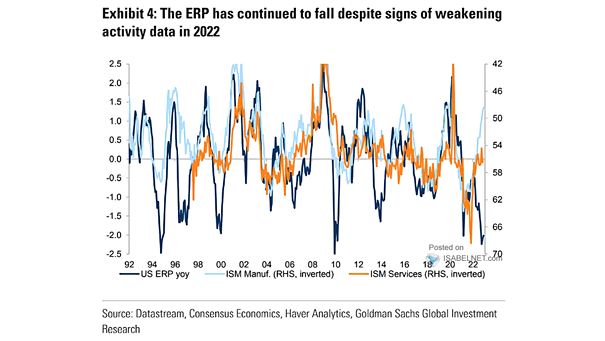
U.S. Equity Risk Premium vs. ISM Manufacturing and ISM Services The equity risk premium is likely to rise if a U.S. recession occurs this year. Image: Goldman Sachs Global Investment Research