Inflation – U.S. ISM Services PMI vs. U.S. CPI
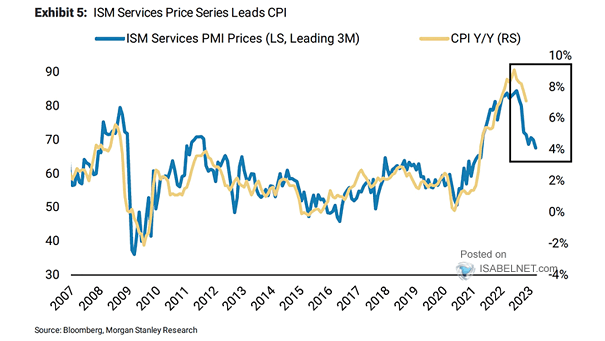
Inflation – U.S. ISM Services PMI vs. U.S. CPI The ISM Services PMI tends to lead U.S. CPI by three months. Image: Morgan Stanley Research
Inflation – U.S. ISM Services PMI vs. U.S. CPI The ISM Services PMI tends to lead U.S. CPI by three months. Image: Morgan Stanley Research
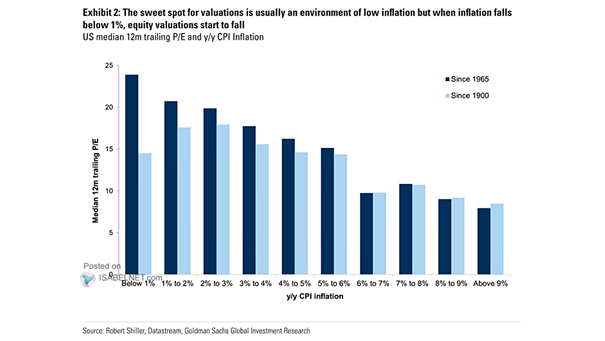
Valuation – U.S. Median 12-Month Trailing P/E and YoY CPI Inflation Historically, the sweet spot for valuations is generally a low inflation environment, between 1% and 3%. Image: Goldman Sachs Global Investment Research
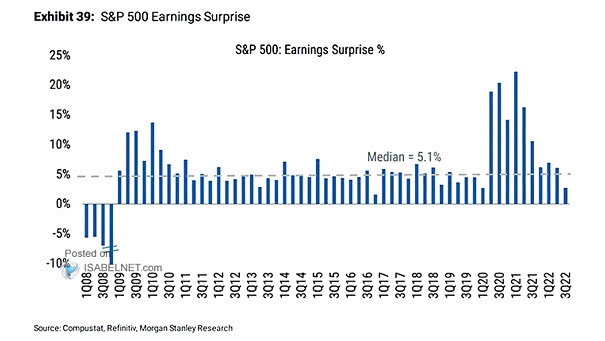
S&P 500 Earnings Surprise % Recent earnings surprises are slightly positive. Image: Morgan Stanley Research
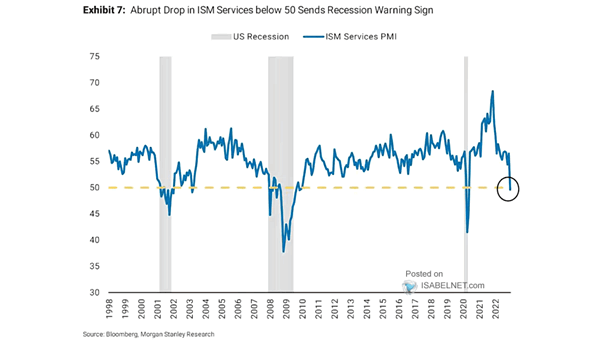
U.S. Recessions and ISM Services PMI The ISM Services PMI below 50 is a warning signal of a coming recession in the United States. Image: Morgan Stanley Research
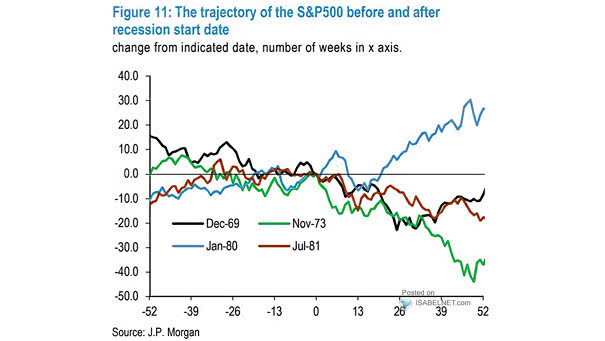
The Trajectory of the S&P 500 Before and After Recession Start Date Will U.S. stocks follow the same trajectory as the 1969 recession? Image: J.P. Morgan
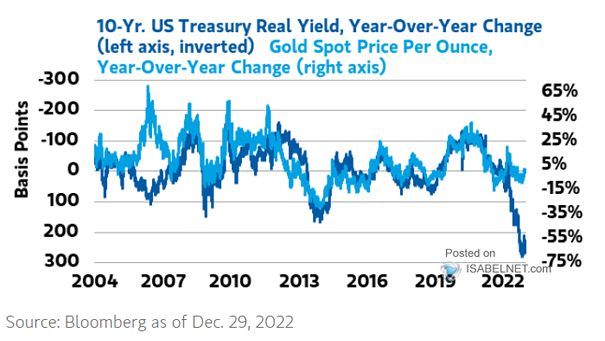
Gold Price vs. 10-Year U.S. Treasury Real Yield Rising real yields (inverted) did not have a major impact on the price of gold last year. Image: Morgan Stanley Wealth Management
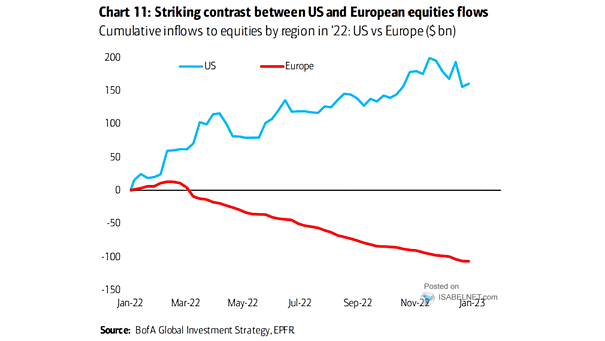
Cumulative Inflows to Equities by Region Will outflows from european equities persist? Image: BofA Global Investment Strategy
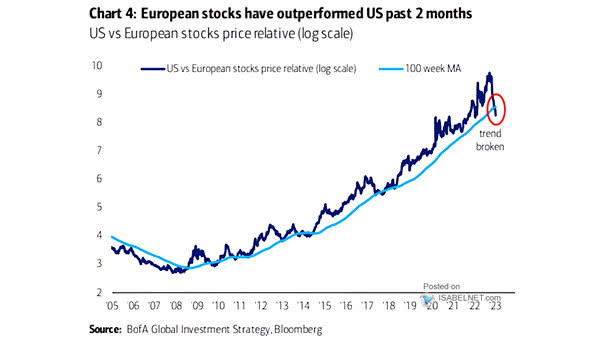
Performance – U.S. vs. European Stocks Price Relative Will European stocks continue to outperform U.S. stocks in 2023? Image: BofA Global Investment Strategy
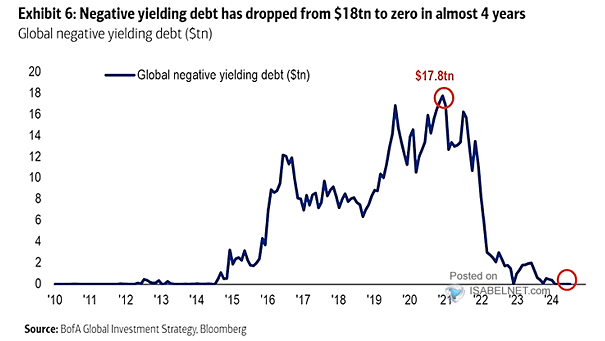
Global Negative Yielding Debt The transition from $18 trillion to zero in negative-yielding debt over the past few years reflects a broader shift away from the era of ultra-low interest rates and easy monetary policy. Image: BofA Global Investment Strategy
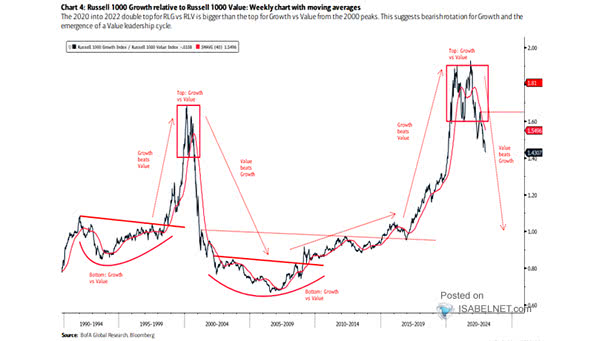
Growth vs. Value – Russell 1000 Growth vs. Russell 1000 Value Should U.S. equity investors definitely shift their focus from growth to value stocks? Image: BofA Global Research