Active Global Equity Flows
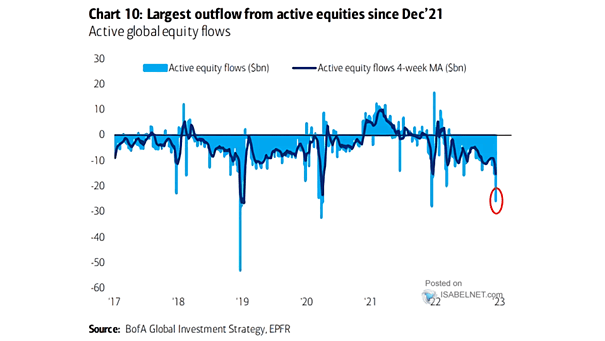
Active Global Equity Flows Outflows from active global equities persist. Image: BofA Global Investment Strategy
Active Global Equity Flows Outflows from active global equities persist. Image: BofA Global Investment Strategy
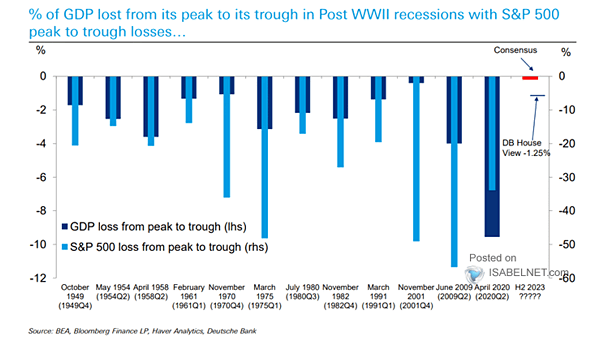
U.S. Recession – GDP Loss and S&P 500 Loss from Peak to Trough Should investors expect a mild U.S. recession in 2023? Image: Deutsche Bank
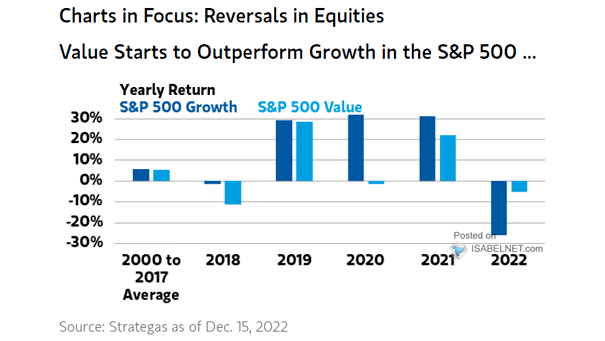
Returns – S&P 500 Growth vs. S&P 500 Value Should investors continue to overweight value vs. growth stocks? Image: Morgan Stanley Wealth Management
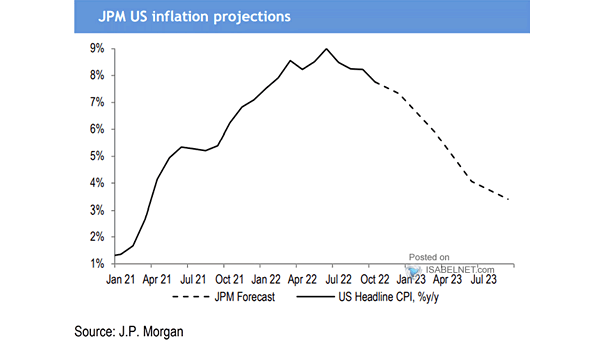
Inflation – U.S. CPI Projections As U.S. inflation is expected to decline, could the Fed be less hawkish in 2023? Image: J.P. Morgan
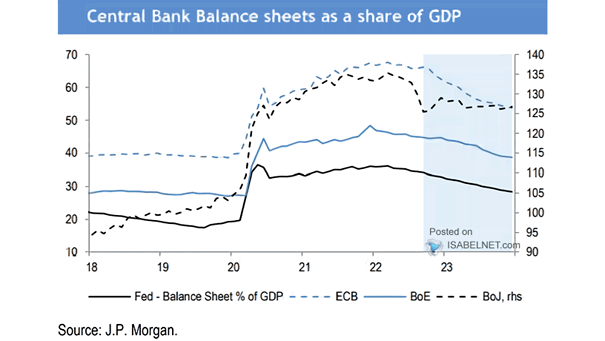
Central Bank Balance Sheets as a Share of GDP Will the reduction of central bank balance sheets increase pressure on financial markets in 2023? Image: J.P. Morgan
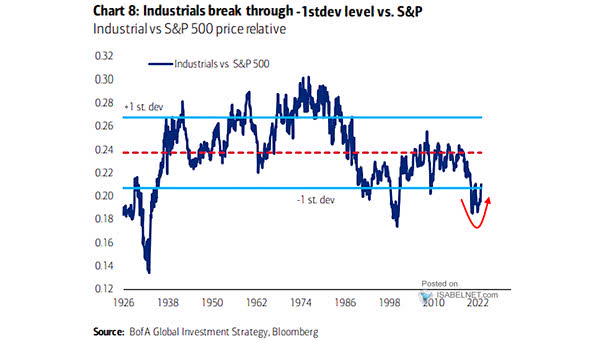
Performance – Industrials vs. S&P 500 Price Relative Will industrials outperform the S&P 500 in 2023? Image: BofA Global Investment Strategy
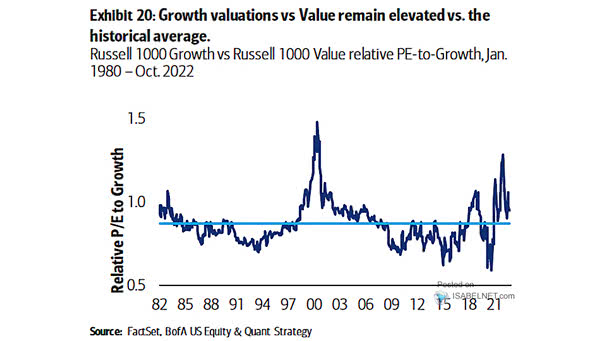
Valuation – Russell 1000 Growth vs. Russell 1000 Value Relative PE-to-Growth Should U.S. equity investors still continue to favor value over growth stocks? Image: BofA US Equity & Quant Strategy
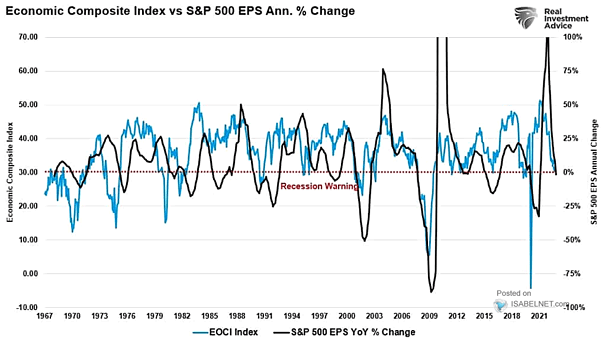
Economic Composite Index vs. S&P 500 EPS YoY % Change U.S. economic activity is highly correlated with S&P 500 earnings growth. Should U.S. equity investors be worried? Image: Real Investment Advice
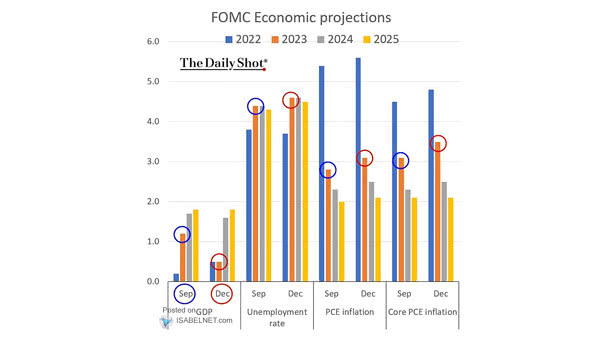
U.S. GDP, Inflation and Unemployment – FOMC Economic Projections The Fed is forecasting an unemployment rate of 4.6% in 2023. Image: The Daily Shot
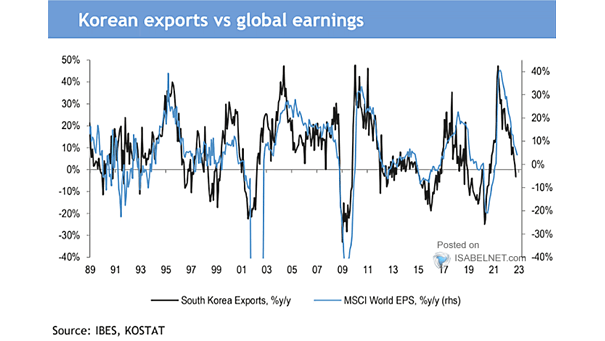
South Korea Exports vs. MSCI World EPS South Korea’s exports tend to lead global earnings. Image: J.P. Morgan
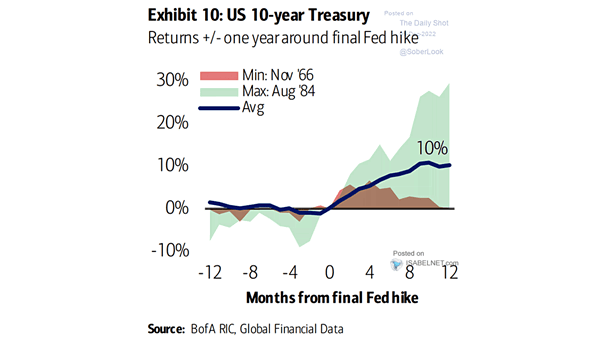
U.S. 10-Year Treasury – Returns +/- One Year Around Final Fed Hike Will U.S. 10-year Treasury yields fall in 2023, once the Fed stops raising rates? Image: BofA Research Investment Committee