Gold in U.S. Dollar vs. Gold in Japanese Yen vs. Gold in Euros
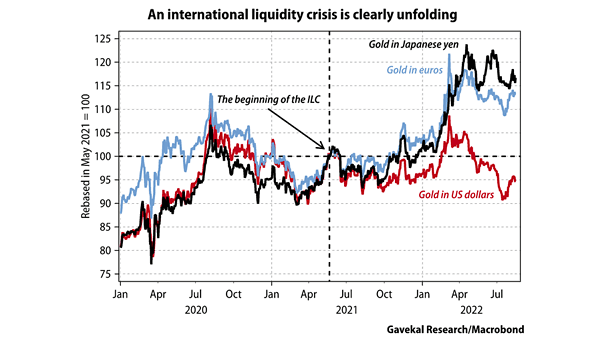
Gold in U.S. Dollar vs. Gold in Japanese Yen vs. Gold in Euros Should markets be worried about an international liquidity crisis? Image: Gavekal, Macrobond
Gold in U.S. Dollar vs. Gold in Japanese Yen vs. Gold in Euros Should markets be worried about an international liquidity crisis? Image: Gavekal, Macrobond
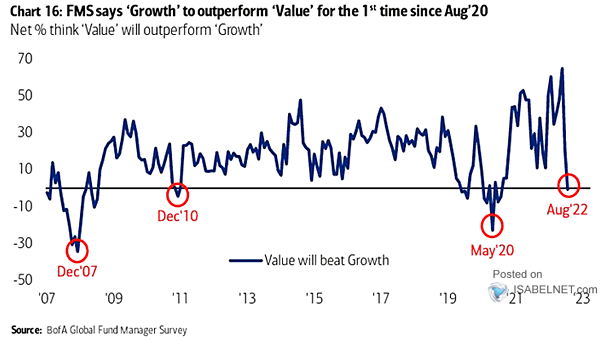
FMS Investors – Net % Say Value Will Beat Growth Will growth stocks outperform value stocks? Image: BofA Global Fund Manager Survey
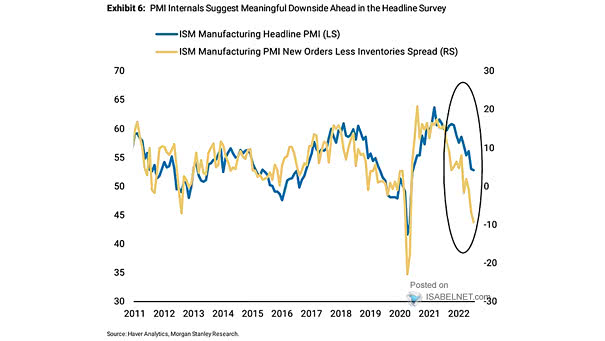
ISM Manufacturing PMI Headline vs. ISM Manufacturing New Orders – Inventories The ISM New Orders less Inventories suggests a lower ISM Manufacturing PMI. Image: Morgan Stanley Research
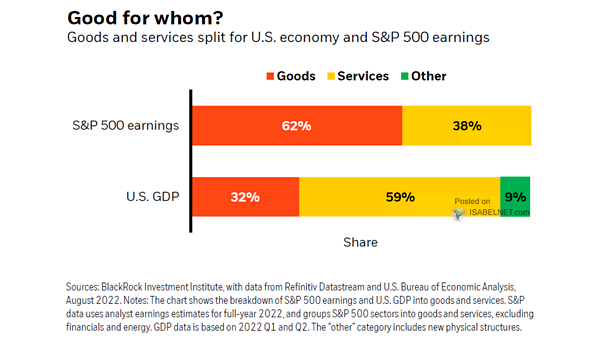
Goods and Services Split for U.S. Economy and S&P 500 Earnings Cooling demand for goods could hit U.S. stocks. Image: BlackRock Investment Institute
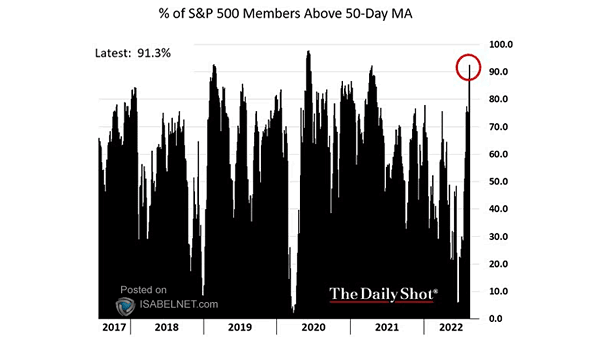
% of S&P 500 Members Trading Above 50-Day Moving Average Short-term overbought, but more than 90% of stocks above the 50-day moving average is historically bullish. Image: The Daily Shot
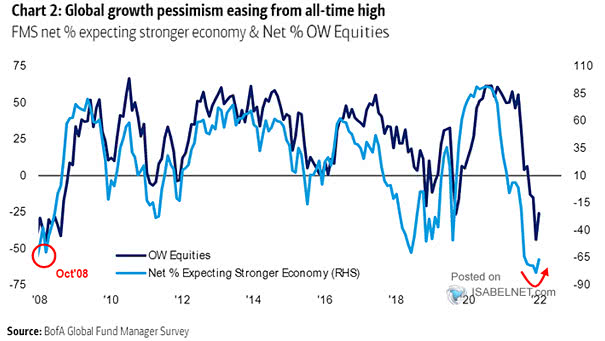
Net % OW Equities vs. Net % Expecting Stronger Economy Pessimism about global growth is easing, suggesting a higher net equity allocation. Image: BofA Global Fund Manager Survey
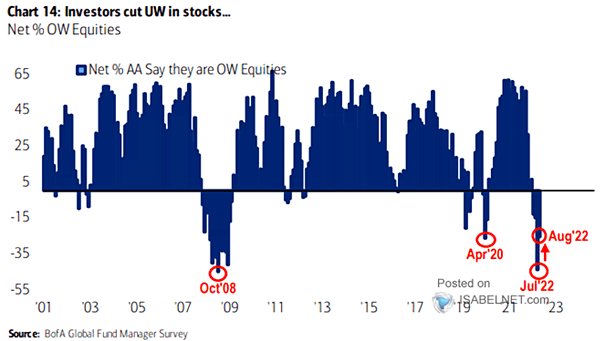
Net % OW Equities FMS investors cut their net underweight in stocks to -26% from -44%. Image: BofA Global Fund Manager Survey
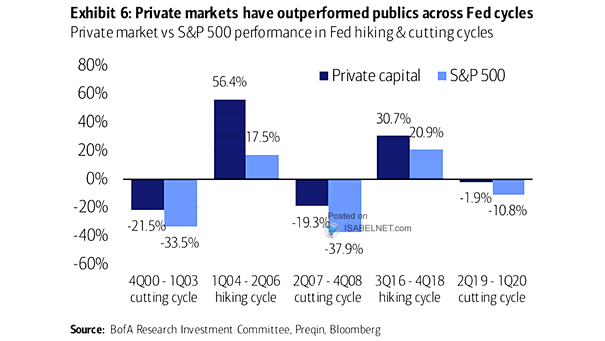
Private Market vs. S&P 500 Performance in Fed Hiking and Cutting Cycles Will private markets continue to outperform public markets? Image: BofA Research Investment Committee
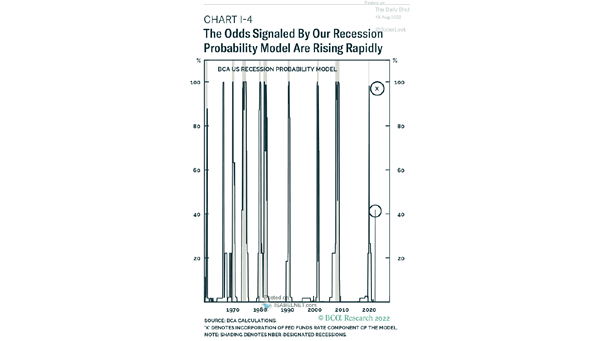
U.S. Recession Probability Model The odds of a recession in the United States continue to rise. Image: BCA Research
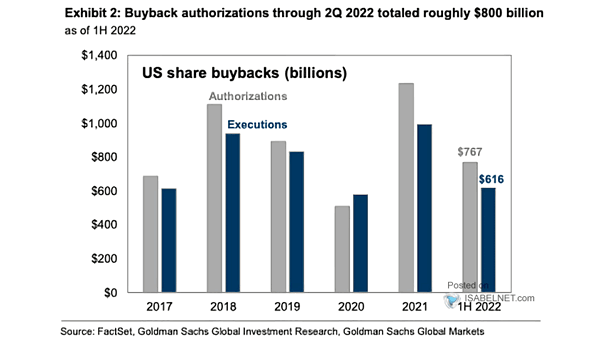
U.S. Share Buybacks Will U.S. share buybacks in 2022 surpass last year’s pace? Image: Goldman Sachs Global Investment Research
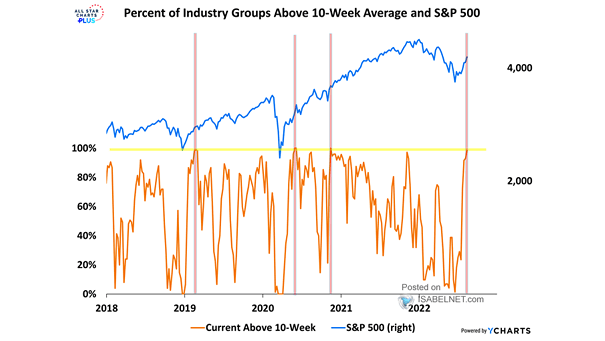
Percent of Industry Groups Above 10-Week Average and S&P 500 Is the current rally in U.S. equities more than just a bear market bounce, as 99% of industry groups are above their 10-week average? Image: All Star Charts