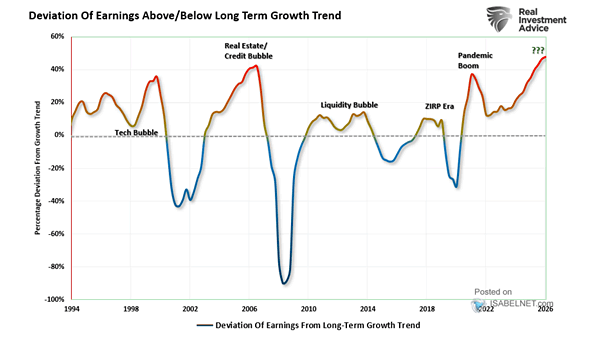
Gold vs. 1970s
Gold vs. 1970s Gold has been shining bright, but it’s nowhere near the late-1970s gold rush. Investors might want to keep an open mind. Image: Bloomberg
Seasonality – S&P 500 Index Returns in December As the holidays approach, buyers usually return and the year-end rally tends to pick up speed in the second half of December. Historically, U.S. stocks have climbed an average of 1.4% during the month. Image: Carson Investment Research
Index Performance – S&P 500, Nasdaq 100, Russell 2000, Mag 7 The broad market is quietly rotating: the S&P 500 is just below its October highs, but small caps and the average stock are outperforming, while mega-cap growth and Tech soften. Image: Deutsche Bank Asset Allocation
S&P 500 Trend Channel Valuations may look stretched, but the S&P 500 has held a steady 22.7% annualized uptrend since October 2022 and now sits near the bottom of that trend channel. Image: Deutsche Bank Asset Allocation
S&P 500 Valuation Multiples With valuations lofty and expectations running high, U.S. stocks look exposed if earnings or the economy disappoint. Image: Real Investment Advice
Stocks – Dow Jones with Major Geopolitical Events The Dow Jones closed at another record high. While the usual chorus warns of bubbles and busts, U.S. stocks keep tuning out the noise, proving once again that patience is still the strongest trade. Image: Carson Investment Research
S&P 500 and U.S. IPO Activity The IPO market is showing signs of life. A pickup in U.S. listings, paired with improving sentiment in global equities, points to a more bullish medium-term outlook for new issues. Image: Topdown Charts
Margin Debt Balances – YoY % Change Margin debt on the NYSE has surged past $1.1 trillion, up nearly 40% YoY, marking one of the fastest spikes on record. Such rapid increases in borrowing, outpacing overall market gains, have often preceded market peaks. Image: Real Investment Advice
S&P 500 Returns After Fed Cuts Within 2% of an All-Time High Bears are losing ground as history leans bullish. Since 1980, when the Fed has eased policy while the S&P 500 traded within 2% of an all‑time high, the index has risen every time in the next 12 months, averaging a 14.2% gain Image:…
S&P 500 vs. 10-Year U.S. Treasury Yield The S&P 500 has diverged from bonds in December, largely ignoring the bond market selloff despite 10-year Treasury yields rising notably this month. Stocks seem more focused on solid earnings and the upbeat tone in tech than on rising rates. Image: Bloomberg
U.S. Household Equity Ownership vs. S&P 500 Index U.S. households have never been this heavily invested in stocks. The higher the concentration, the greater the risk that a market pullback hits both confidence and consumption, reversing wealth effects. Image: Real Investment Advice