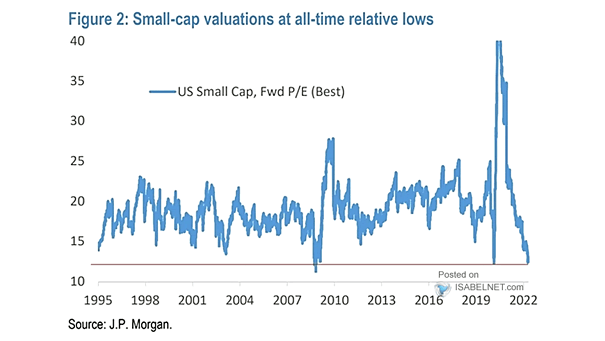
Valuation – U.S. Small Cap Stocks, Fwd P/E
Valuation – U.S. Small Cap Stocks, Fwd P/E Should U.S. equity investors consider overweighting small-cap stocks in their portfolio? Image: J.P. Morgan
Valuation – U.S. Small Cap Stocks, Fwd P/E Should U.S. equity investors consider overweighting small-cap stocks in their portfolio? Image: J.P. Morgan
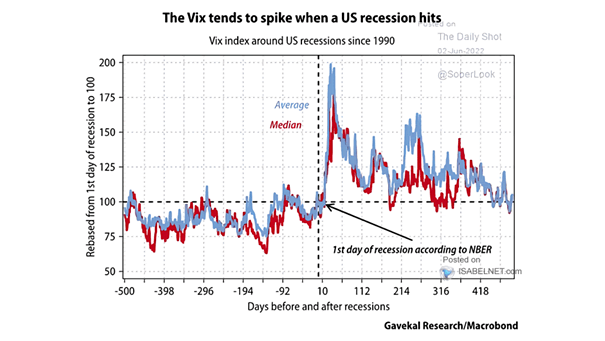
VIX Index Around U.S. Recessions Will U.S. equity markets remain volatile amid inflation and recession fears? Image: Gavekal, Macrobond
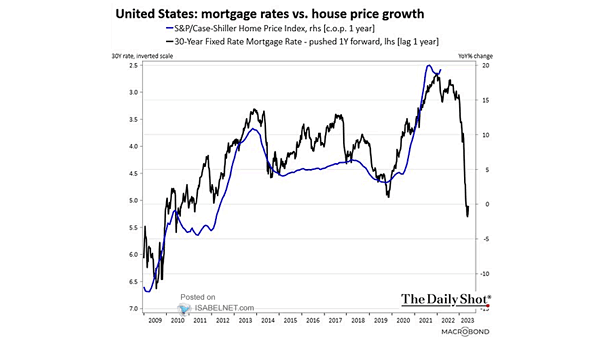
U.S. Mortgage Rates vs. House Price Growth (Leading Indicator) Historically, rising mortgage rates tend to cool house prices. Image: Macrobond
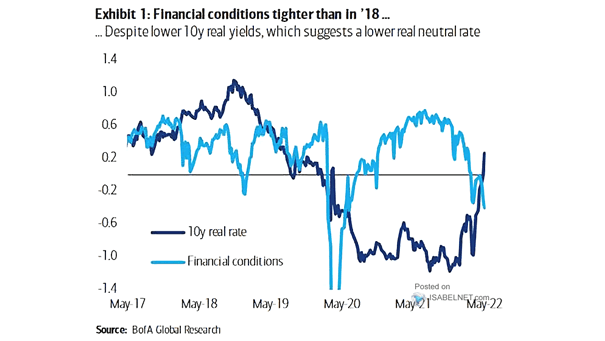
Financial Conditions vs. U.S. 10-Year Real Rate Should investors expect tighter financial conditions? Image: BofA Global Research
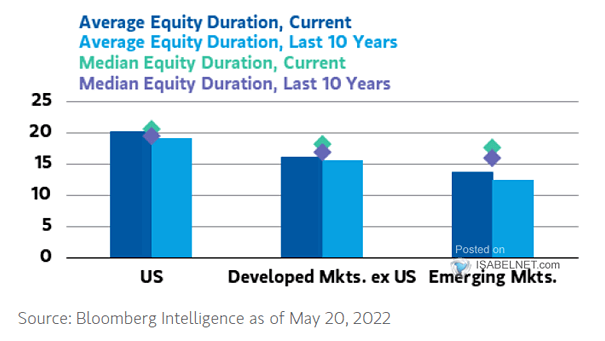
Average and Median Equity Duration U.S. equities are 25% more sensitive to interest rate moves than other developed market equities. Image: Morgan Stanley Wealth Management
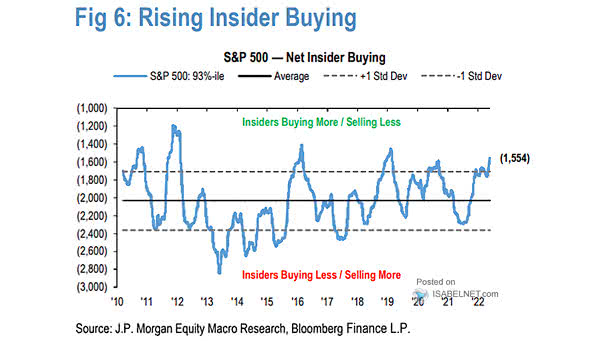
S&P 500 – Net Insider Buying Insider buying tends to be highest around market lows, which is good news for the S&P 500. J.P. Morgan Equity Macro Research
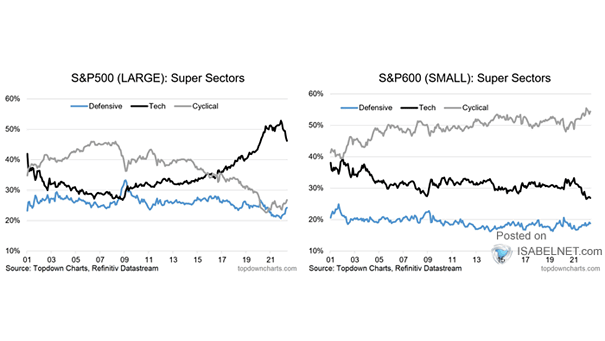
Small-Cap Stocks – S&P 500 Large-Cap Index vs S&P 600 Small-Cap Index Super Sector Weight Trends U.S. small-cap stocks could be under more pressure as U.S. GDP growth slows. Image: Topdown Charts
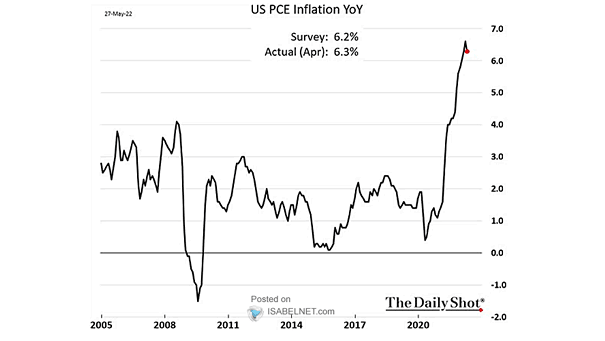
U.S. PCE Inflation Has the Fed’s preferred inflation metric peaked? Image: The Daily Shot
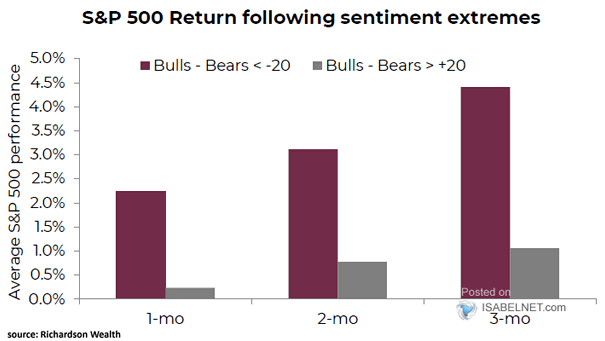
S&P 500 Following Sentiment Extremes The latest AAII U.S. investor sentiment bull – bear spread suggests promising S&P 500 returns over the next few months. Image: Richardson Wealth
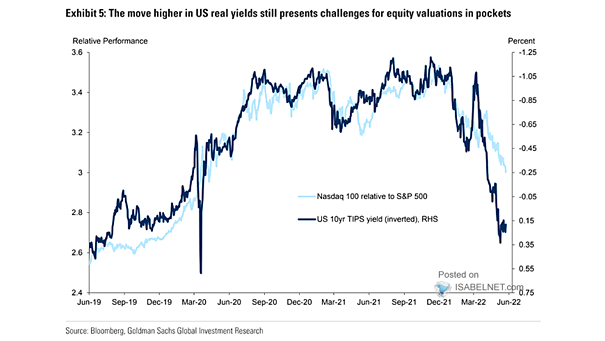
Valuation – Nasdaq 100 Relative to S&P 500 vs. U.S. 10-Year TIPS Yield Historically, it’s good for the U.S. stock market if U.S. real yields remain modestly positive. Image: Goldman Sachs Global Investment Research
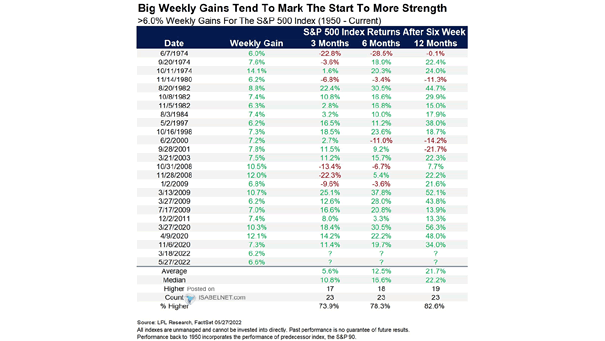
Returns – >6% Weekly Gains for the S&P 500 Index Historically, weekly gains of more than 6% tend to be bullish for U.S. stocks over 3, 6 and 12 months. Image: LPL Research