Flow Pace into Publicly Listed Bitcoin and Ethereum Funds Including ETFs
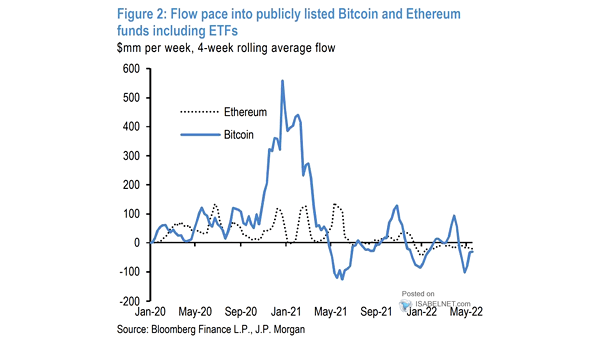
Flow Pace into Publicly Listed Bitcoin and Ethereum Funds Including ETFs Flows into Bitcoin and Ethereum funds remain negative. Image: J.P. Morgan
Flow Pace into Publicly Listed Bitcoin and Ethereum Funds Including ETFs Flows into Bitcoin and Ethereum funds remain negative. Image: J.P. Morgan
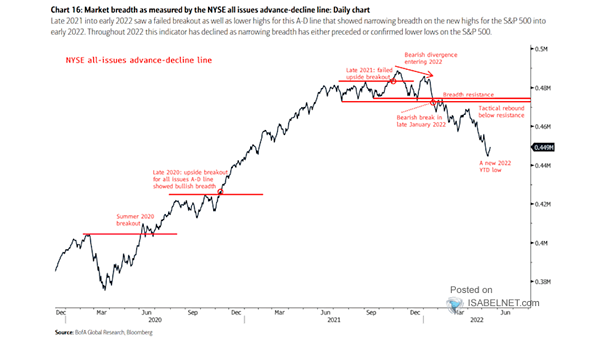
NYSE Stocks Advance-Decline Line Market breadth has declined sharply throughout 2022. Image: BofA Global Research
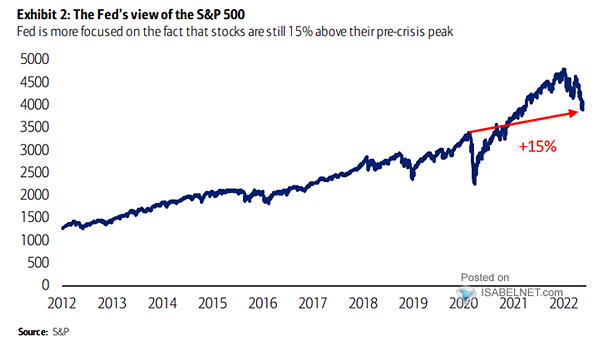
The Fed’s View of the S&P 500 Where is the Fed put? After the recent sell-off, the Fed and investors do not view the S&P 500 through the same lens. Image: BofA Global Research
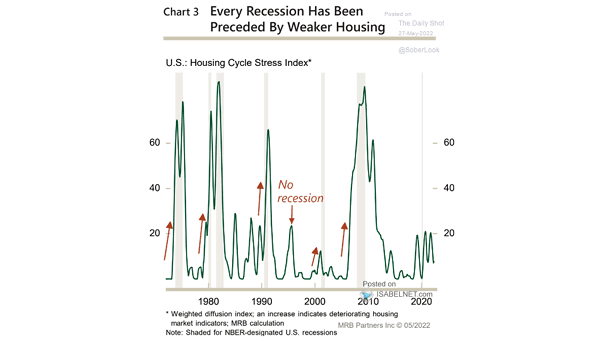
U.S. Recession – Housing Cycle Stress Index Should investors expect the possibility of a significant weakening in the housing sector this year? Image: MBR Partners
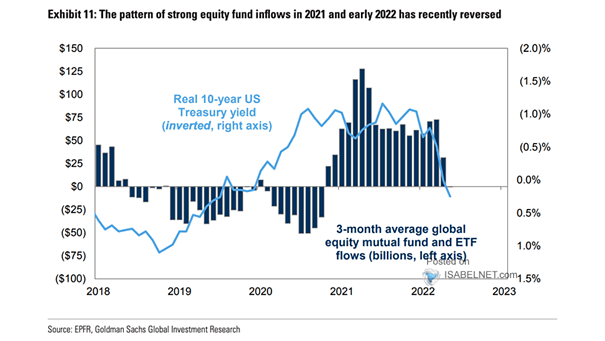
3-Month Average Mutual Fund and ETF Flows and Real 10-Year U.S. Treasury Yield Flows into mutual funds and ETFs have been very strong. Image: Goldman Sachs Global Investment Research
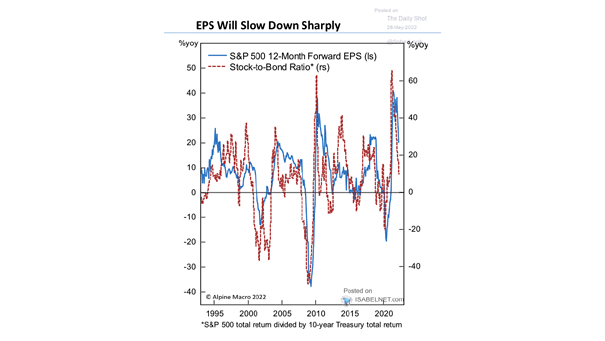
S&P 500 12-Month Forward EPS and Stock-to-Bond Ratio Will the S&P 500 continue to fall as earnings growth slows? Image: Alpine Macro
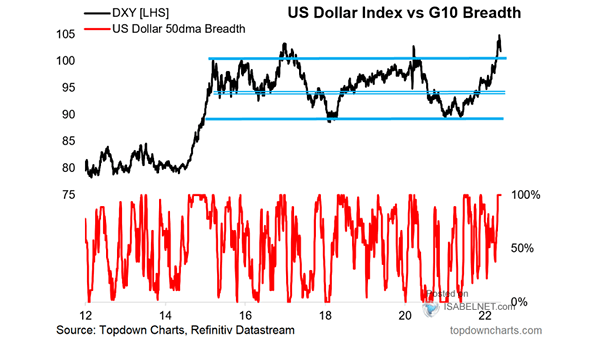
U.S. Dollar Index vs. G10 Breadth Will the U.S. dollar move lower after the recent spike? Image: Topdown Charts
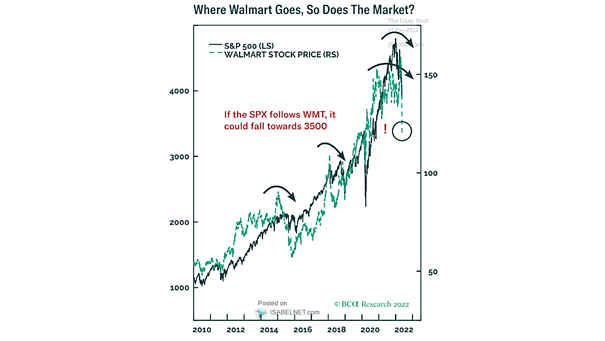
S&P 500 vs. Walmart Stock Price Will the S&P 500 follow Walmart’s stock price? Image: BCA Research
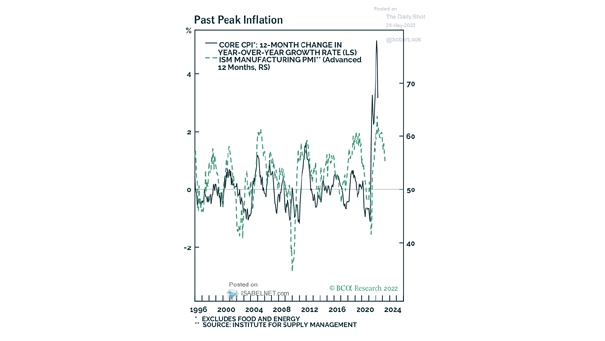
Inflation – U.S. Core CPI vs. ISM Manufacturing PMI (Leading Indicator) The U.S. ISM Manufacturing PMI tends to lead U.S. core CPI by 12 months. Image: BCA Research
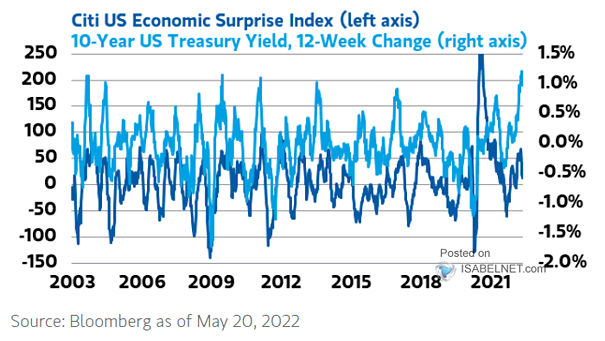
Citi U.S. Economic Surprise Index vs. 10-Year U.S. Treasury Yield Should investors expect U.S. Treasuries to rally? Image: Morgan Stanley Research
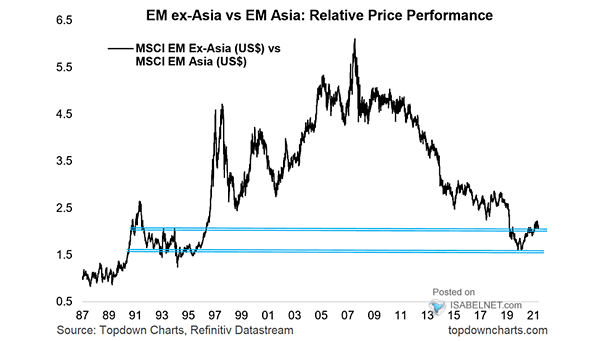
EM ex-Asia vs. EM Asia – Relative Price Performance Should investors continue to favor EM ex-Asia vs. Asia? Image: Topdown Charts