Author: isabelnet
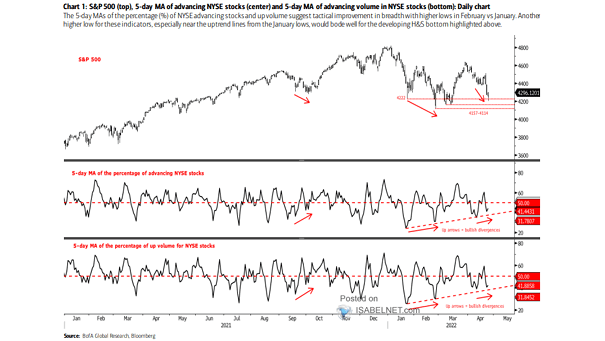
S&P 500 – 5-Day MA of Advancing NYSE Stocks and 5-Day MA of Advancing Volume in NYSE Stocks
S&P 500 – 5-Day MA of Advancing NYSE Stocks and 5-Day MA of Advancing Volume in NYSE Stocks Can U.S. equity investors expect a relief rally? Image: BofA Global Research
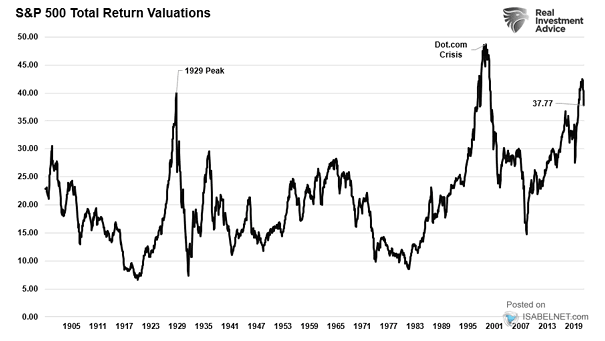
S&P 500 Total Return Valuations
S&P 500 Total Return Valuations Despite the recent sell-off, the valuation of the S&P 500 remains at high levels by historical standards. Image: Real Investment Advice
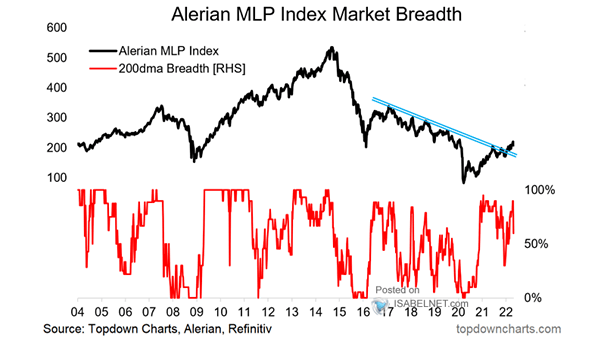
Alerian MLP Index Market Breadth
Alerian MLP Index Market Breadth Should investors remain bullish on energy infrastructure stocks? Image: Topdown Charts
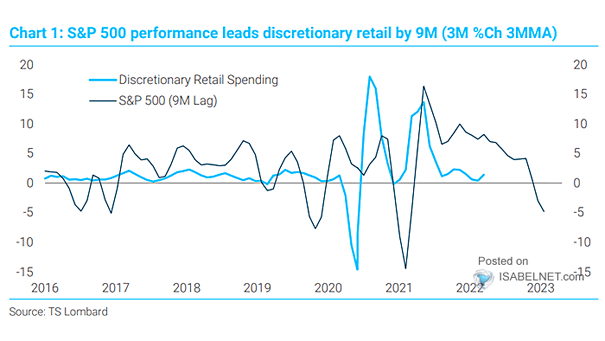
S&P 500 Performance and Discretionary Retail Spending (Leading Indicator)
S&P 500 Performance and Discretionary Retail Spending (Leading Indicator) The performance of the S&P 500 tends to lead discretionary retail spending by 9 months. Image: TS Lombard
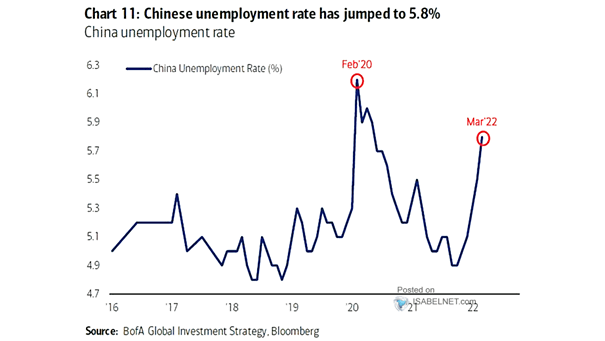
China Unemployment Rate
China Unemployment Rate The Chinese unemployment rate rose to 5.8% in March, as lockdowns weigh on economic activity. Image: BofA Global Investment Strategy
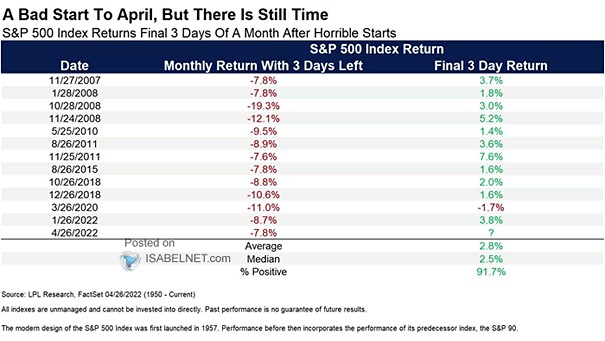
S&P 500 Index Returns Final 3 Days of a Month After Horrible Starts
S&P 500 Index Returns Final 3 Days of a Month After Horrible Starts Can U.S. equity investors expect a bounce in the final three days of this month? Image: LPL Research
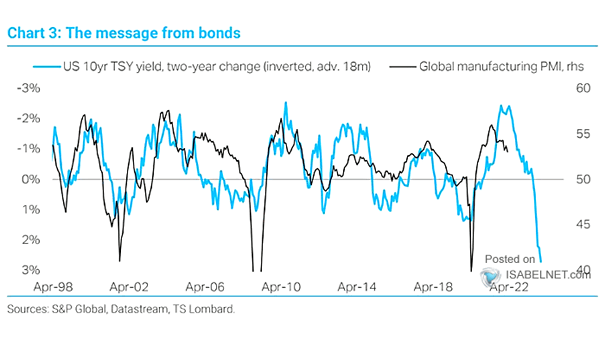
U.S. 10-Year Treasury Yield and Global Manufacturing PMI (Leading Indicator)
U.S. 10-Year Treasury Yield and Global Manufacturing PMI (Leading Indicator) Should investors prepare for a substantial decline in the global economy? Image: TS Lombard
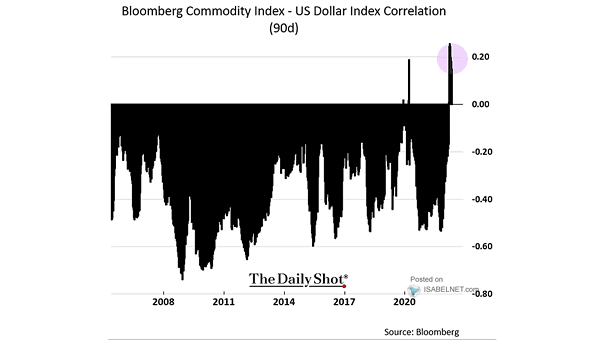
Correlation Between Commodities and the U.S. Dollar
Correlation Between Commodities and the U.S. Dollar Normally, there is an inverse correlation between commodity prices and the U.S. dollar. Image: The Daily Shot
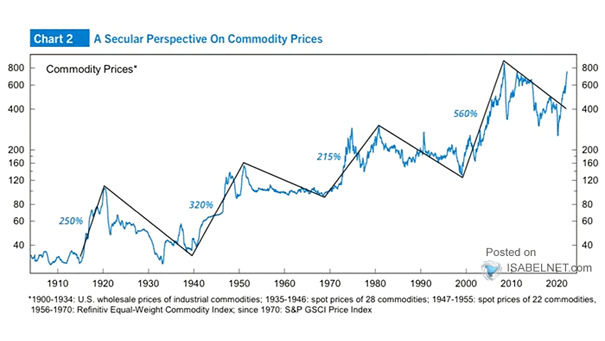
Commodities – Commodity Prices
Commodities – Commodity Prices Is the spike in commodity prices a long-term secular bull market? Image: Alpine Macro
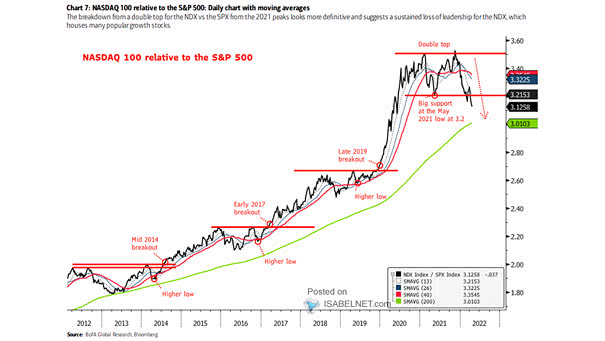
Nasdaq 100 Relative to the S&P 500
Nasdaq 100 Relative to the S&P 500 Will the Nasdaq 100 continue to underperform the S&P 500? Image: BofA Global Research