ISM Manufacturing PMI vs. Mortgage Servicing Costs (Leading Indicator)
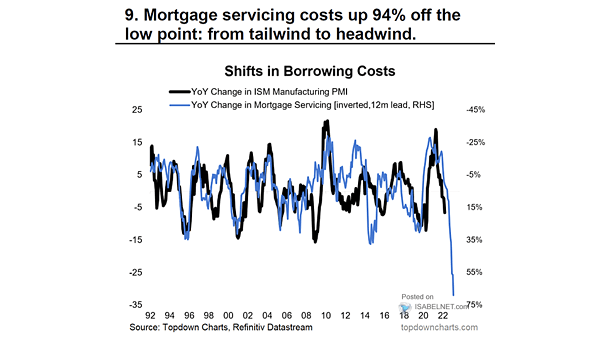
ISM Manufacturing PMI vs. Mortgage Servicing Costs (Leading Indicator) Mortgage servicing costs tend to lead the U.S. ISM Manufacturing PMI by 12 months. Image: Topdown Charts
ISM Manufacturing PMI vs. Mortgage Servicing Costs (Leading Indicator) Mortgage servicing costs tend to lead the U.S. ISM Manufacturing PMI by 12 months. Image: Topdown Charts
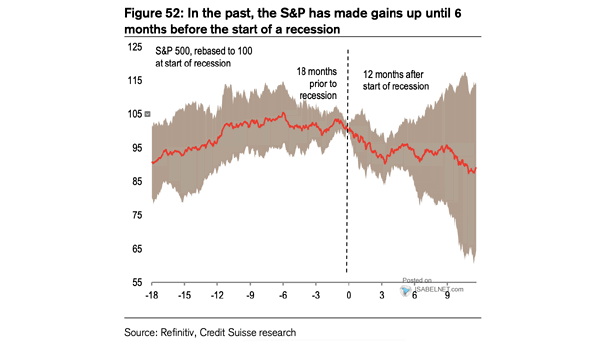
S&P 500 and U.S. Recession Historically, bull market peaks tend to occur 6 months before the start of a recession. Image: Credit Suisse Research
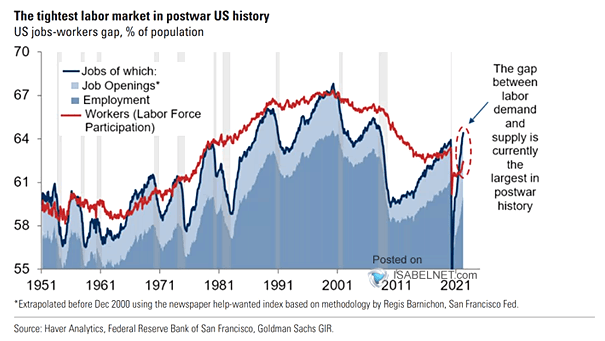
Labor Market – U.S. Jobs-Workers Gap A tight labor market contributes to wage inflation. Image: Goldman Sachs Global Investment Research
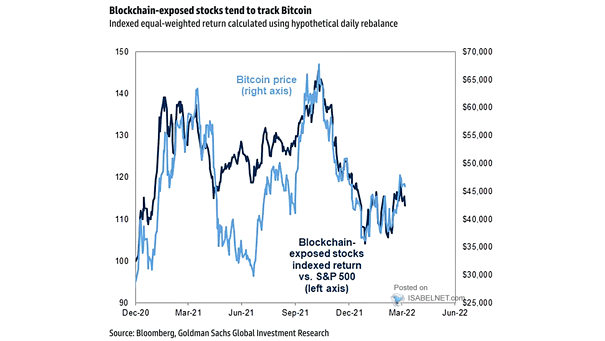
Bitcoin Price and Blockchain-Exposed Stocks Indexed Return vs. S&P 500 The basket of blockchain-exposed stocks tends to track Bitcoin and can be a way to diversify a portfolio. Image: Goldman Sachs Global Investment Research
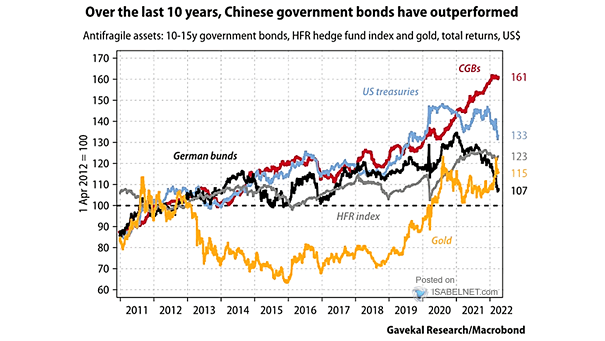
Antifragile Assets – 10-15Y Government Bonds, HFR Hedge Funds Index and Gold, Total Returns Should investors favor Chinese government bonds? Image: Gavekal, Macrobond
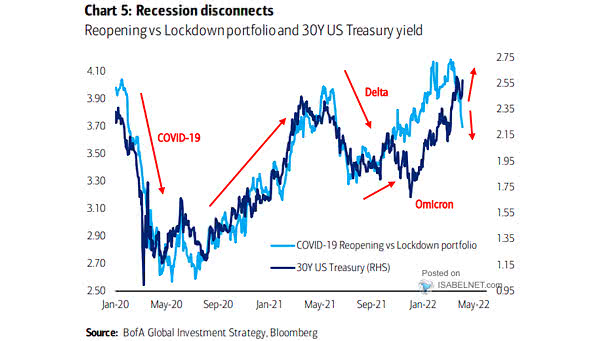
Performance – COVID-19 Reopening vs. Lockdown Portfolio and U.S. 30-Year Treasury Yield BofA expects 30-year U.S. Treasury yields to rise and the “reopening portfolio” to fall. Image: BofA Global Investment Strategy
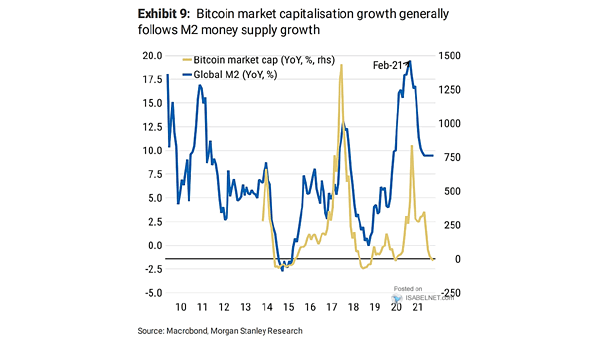
Bitcoin Market Capitalization and Global M2 Money Supply Bitcoin could fall if global M2 money supply continues to slow. Image: Morgan Stanley Research
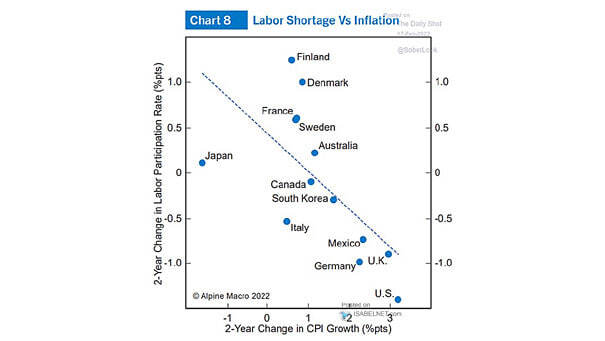
Inflation – 2-Year Change in Labor Participation Rate and 2-Year Change in CPI Growth Labor shortages contribute to inflation. Image: Alpine Macro
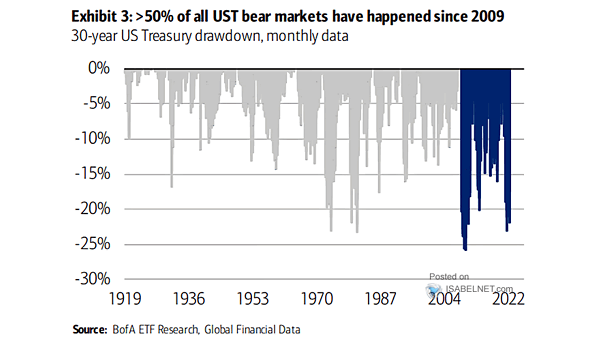
Bear Markets – 30-Year U.S. Treasury Drawdown Will the U.S. Treasury bond market continue to sell off? Image: BofA ETF Research
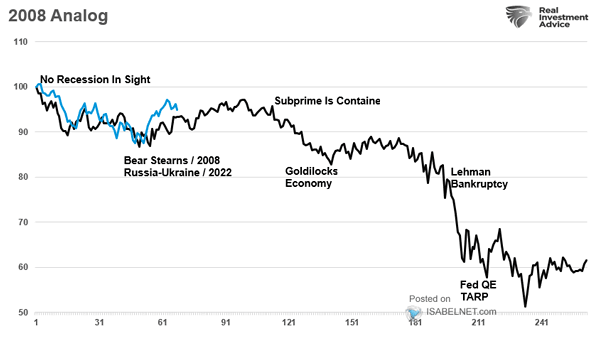
S&P 500 – 2008 vs. 2022 Is a recession coming in the United States? So far, the S&P 500 is tracking the 2008 analog. Image: Real Investment Advice
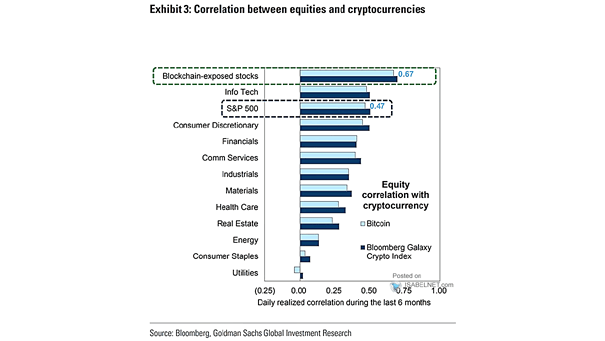
Bitcoin – Correlation Between Equities and Cryptocurrencies The S&P 500 and Bitcoin are increasingly correlated. Image: Goldman Sachs Global Investment Research