U.S. Stocks – Value vs. Growth
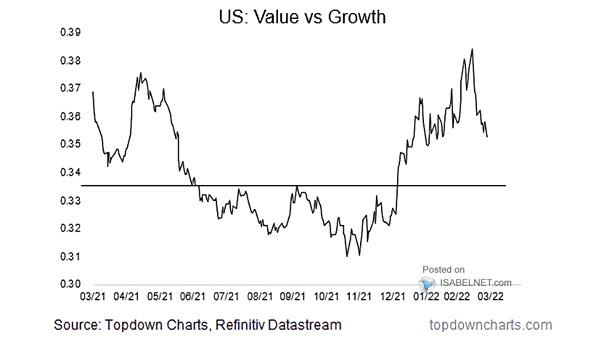
U.S. Stocks – Value vs. Growth Could growth stocks outperform value stocks in a context of slowing global growth? Image: Topdown Charts
U.S. Stocks – Value vs. Growth Could growth stocks outperform value stocks in a context of slowing global growth? Image: Topdown Charts
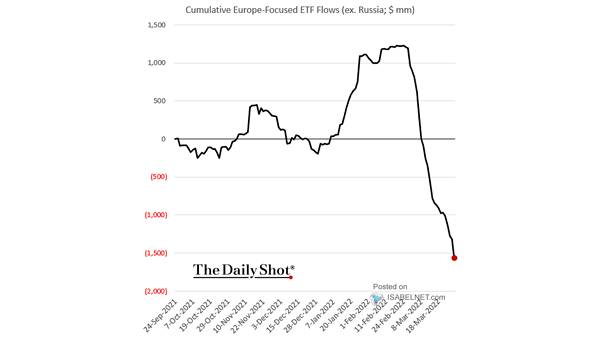
Cumulative Europe-Focused ETF Flows Outflows from Europe-focused ETFs remain strong. Image: The Daily Shot
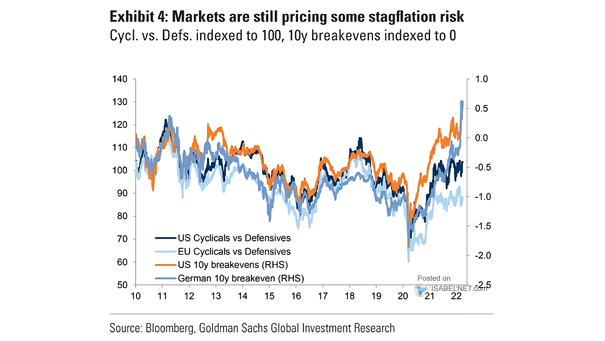
Cyclicals vs. Defensives and 10-Year Breakeven Does stagflation pose a threat to markets? Image: Goldman Sachs Global Investment Research
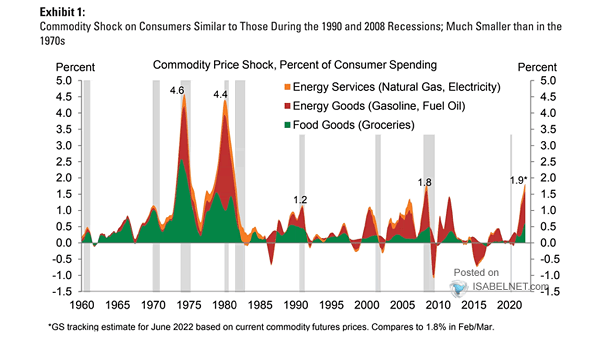
Commodities – Commodity Price Shock, Percent of Consumer Spending The commodity price shock on consumers is not yet at the level of the 1970s. Image: Goldman Sachs Global Investment Research
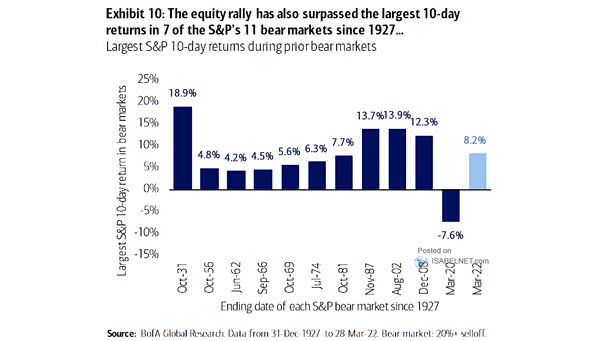
Largest S&P 500 10-Day Returns During Prior Bear Markets The recent U.S. equity rally has been very strong. Image: BofA Global Research
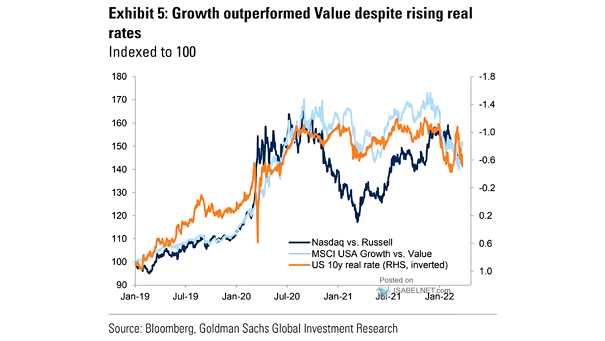
Stocks – Nasdaq vs. Russell, MSCI USA Growth vs. Value and U.S. 10-Year Real Rate Will growth stocks continue to outperform value stocks despite rising real rates? Image: Goldman Sachs Global Investment Research
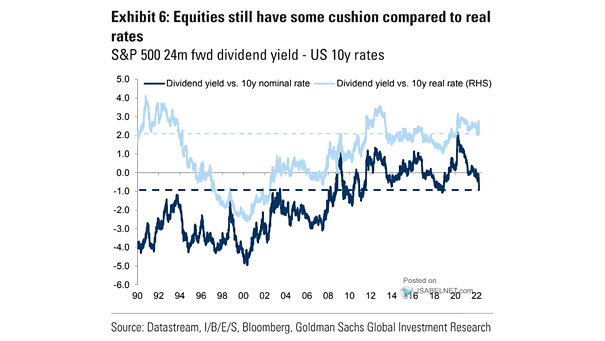
S&P 500 24-Month Forward Dividend Yield vs. U.S. 10-Year Rates Negative real rates are still supporting U.S. equities. Image: Goldman Sachs Global Investment Research
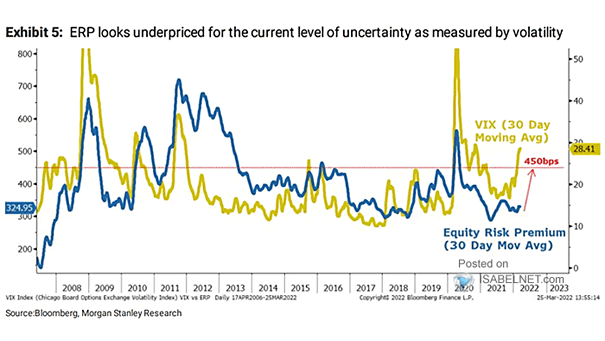
S&P 500 Equity Risk Premium and VIX The equity risk premium is sensitive to changes in the VIX. Image: Morgan Stanley Research
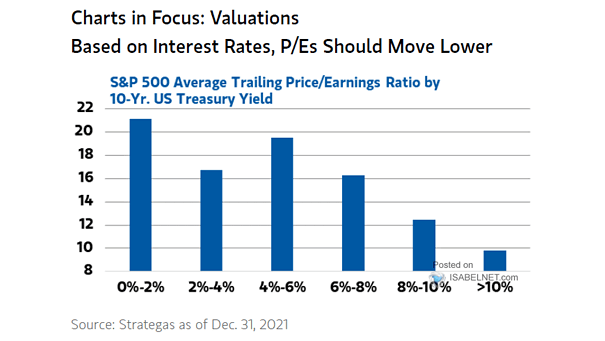
Valuation – S&P 500 Average Trailing P/E Ratio by 10-Year U.S. Treasury Yield Is the S&P 500 P/E ratio too high, based on interest rates? Image: Morgan Stanley Wealth Management
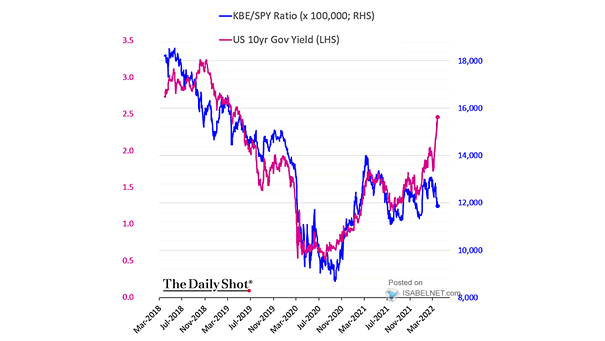
Performance – KBE/SPY Ratio vs. U.S. 10-Year Government Bond Yield With rates rising rapidly, will bank stocks outperform the S&P 500? Image: The Daily Shot
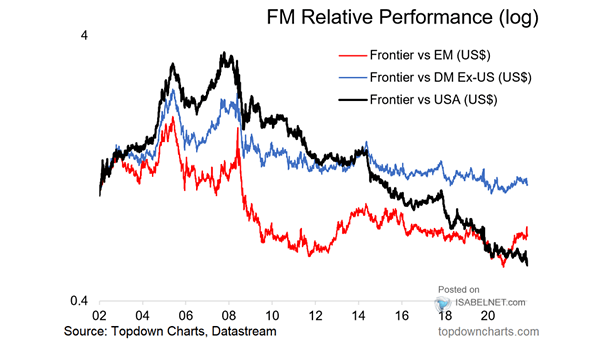
Frontier Markets Relative Performance Should long-term investors have frontier stocks in their portfolios, as FM valuations are decent? Image: Topdown Charts