S&P 500 Index Returns After Three Consecutive 1% Gains
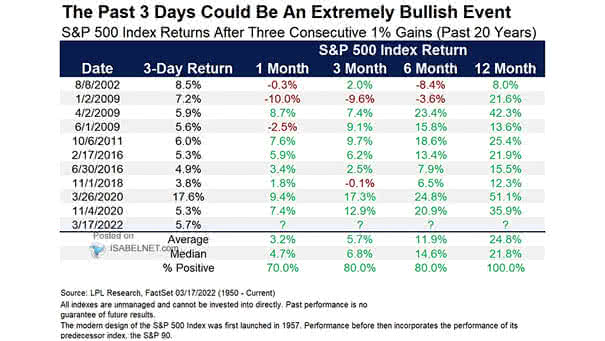
S&P 500 Index Returns After Three Consecutive 1% Gains The performance of the S&P 500 this week suggests that the bull market is not over yet. Image: LPL Research
S&P 500 Index Returns After Three Consecutive 1% Gains The performance of the S&P 500 this week suggests that the bull market is not over yet. Image: LPL Research
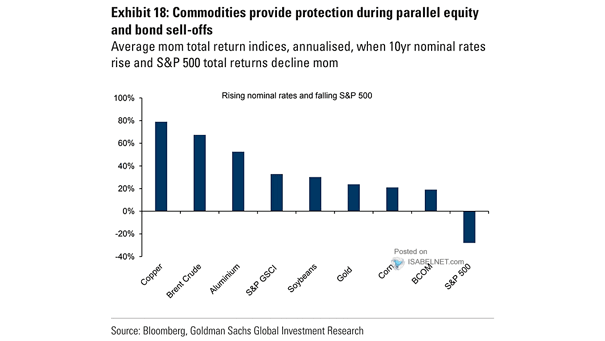
Returns – Rising Nominal Rates and Falling S&P 500 Should investors continue to favor commodities? Image: Goldman Sachs Global Investment Research
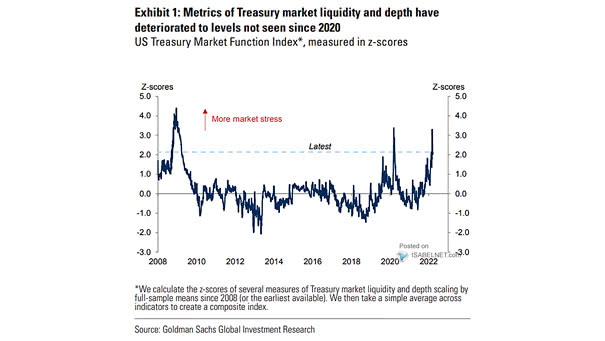
U.S. Treasury Market Liquidity and Depth U.S. Treasury market liquidity and depth have deteriorated significantly this year. Image: Goldman Sachs Global Investment Research
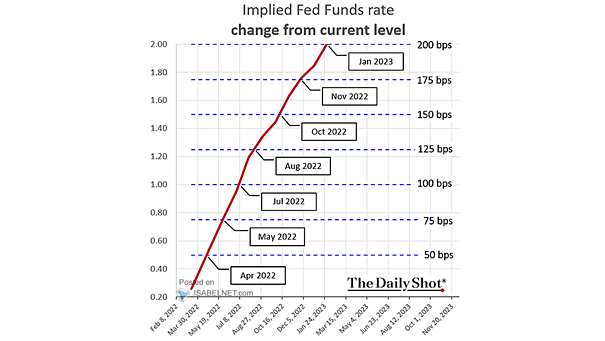
Interest Rates – Implied Fed Funds Rate, Change From Current Level Should investors expect the federal funds rate to be at 2% in January 2023? Image: The Daily Shot
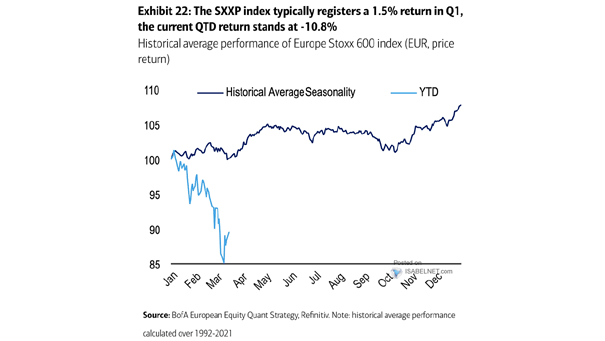
Seasonality – Historical Average Performance of Europe Stoxx 600 Index So far, the Europe Stoxx 600 Index has not moved in line with its seasonal pattern. Image: BofA European Equity Quant Strategy
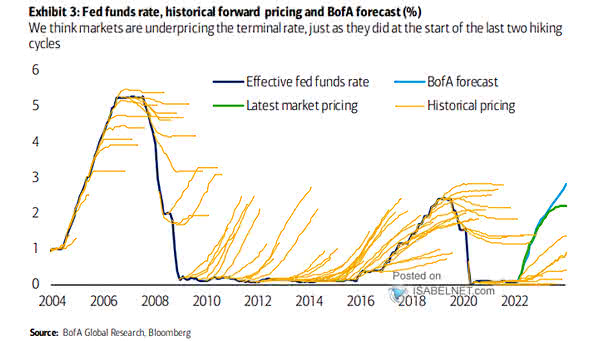
Interest Rates – Fed Funds Rate, Historical Forward Pricing and Forecast Are markets underpricing Fed rate hikes in 2023? Image: BofA Global Research
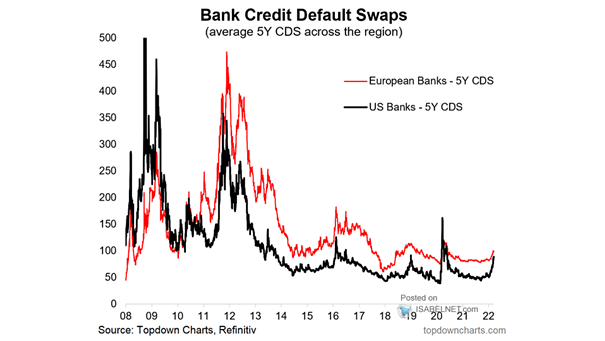
Bank Credit Default Swaps Should investors worry that bank credit default swaps (CDS) have risen sharply recently? Image: Topdown Charts
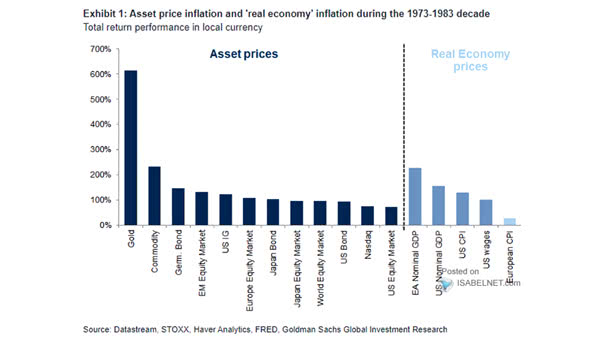
Asset Price Inflation and “Real Economy” Inflation Gold performed well during the 1973-1983 decade. Image: Goldman Sachs Global Investment Research
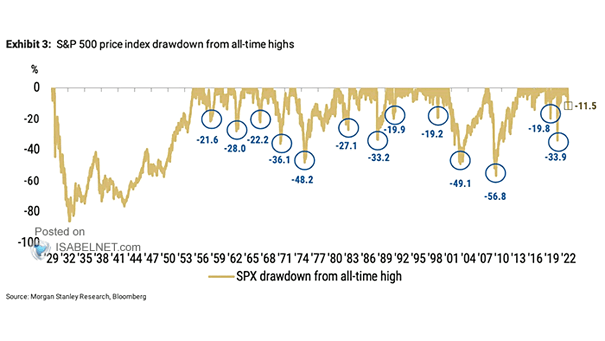
S&P 500 Price Index Drawdown from All-Time Highs Drawdowns happen all the time and don’t have a precise time to start or end. Image: Morgan Stanley Research
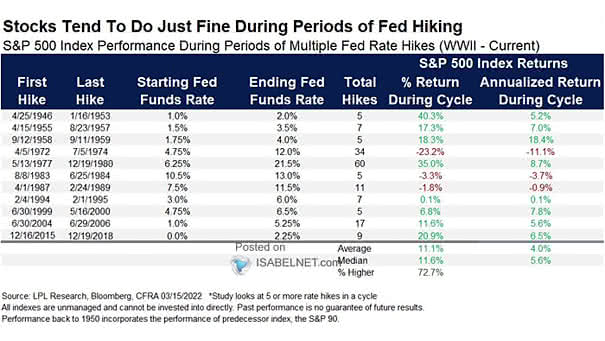
S&P 500 Index Performance During Periods of Multiples Fed Rate Hikes Historically, Fed rate hikes cycles are not a threat to the S&P 500 Index. Image: LPL Research
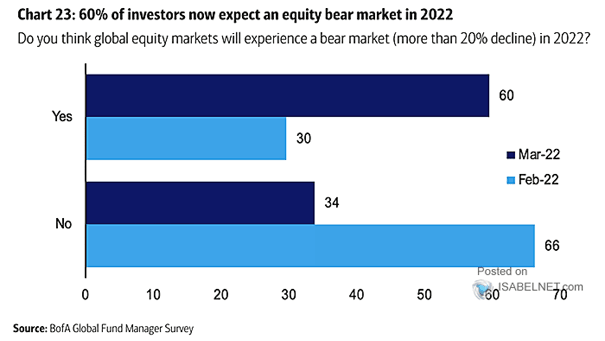
Do You Think Global Equity Markets Will Experience a Bear Market? Most FMS investors expect that global equity markets will experience a bear market this year. Image: BofA Global Fund Manager Survey