% of S&P 500 Stocks Above Their 200-Day Moving Average
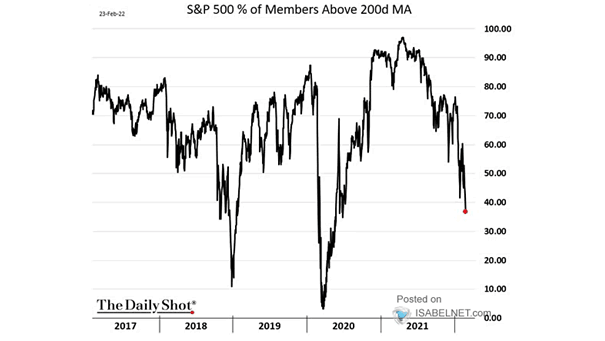
% of S&P 500 Stocks Above Their 200-Day Moving Average Can investors expect a relief rally in U.S. stocks? Image: The Daily Shot
% of S&P 500 Stocks Above Their 200-Day Moving Average Can investors expect a relief rally in U.S. stocks? Image: The Daily Shot
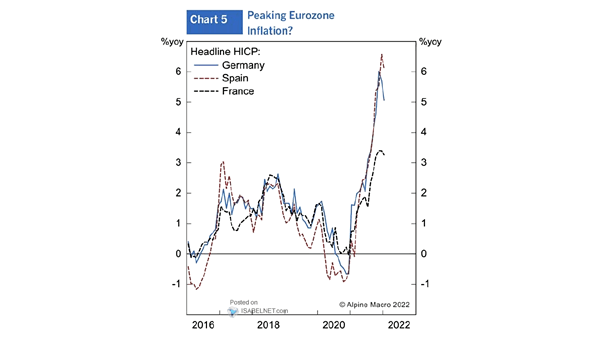
Inflation in the Euro Zone Has headline inflation peaked in the euro zone? Image: Alpine Macro
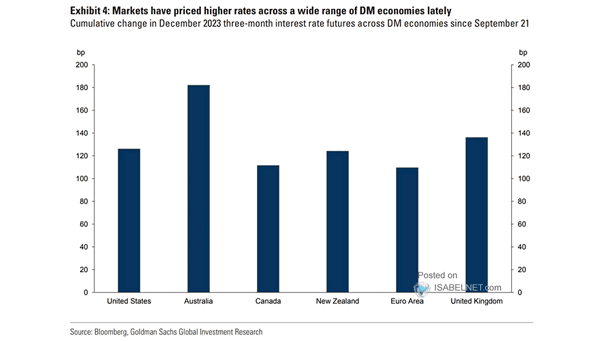
Cumulative Change in Three-Month Interest Rates Futures Across DM Economies Markets expect higher interest rates in several DM economies. Image: Goldman Sachs Global Investment Research
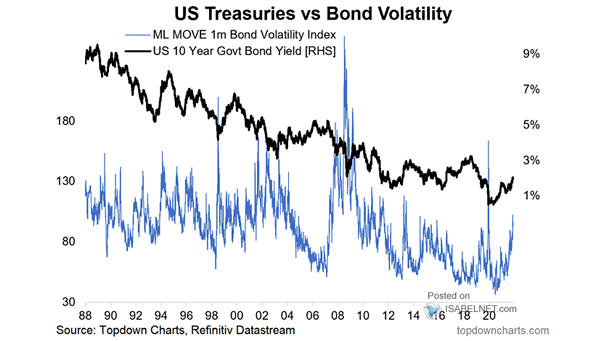
U.S. Treasuries vs. Bond Volatility Is it time to be bullish on U.S. Treasury bonds? Image: Topdown Charts
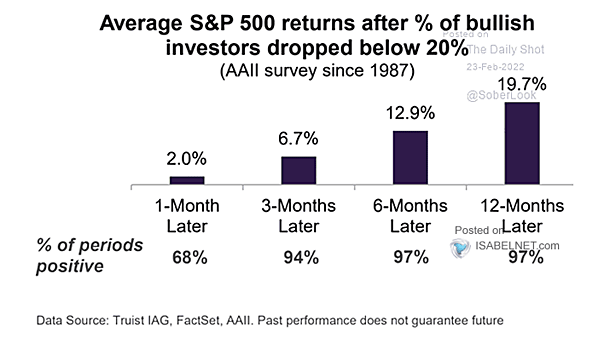
AAII Survey – Average S&P 500 Returns After % of Bullish Investors Dropped Below 20% The AAII Bullish Sentiment is below 20%, which is contrarian bullish. Image: Truist
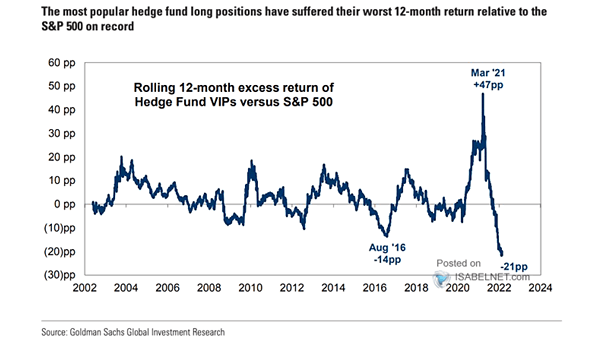
Rolling 6-Month Excess Return of Hedge Fund VIPs vs. S&P 500 The most popular hedge fund long positions have largely underperformed the broader market over the past 12 months. Image: Goldman Sachs Global Investment Research
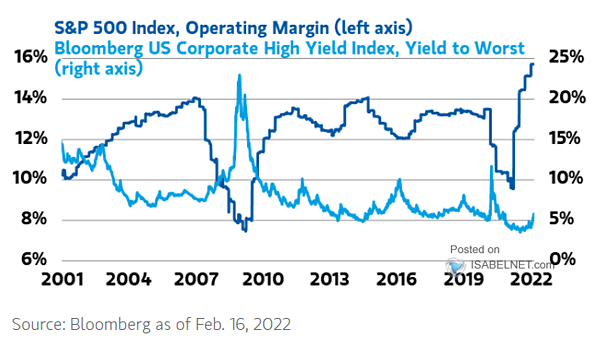
S&P 500 Index Operating Margin and U.S. Corporate High Yield Index High yield bonds may suggest a decline in corporate operating margins. Image: Morgan Stanley Wealth Management
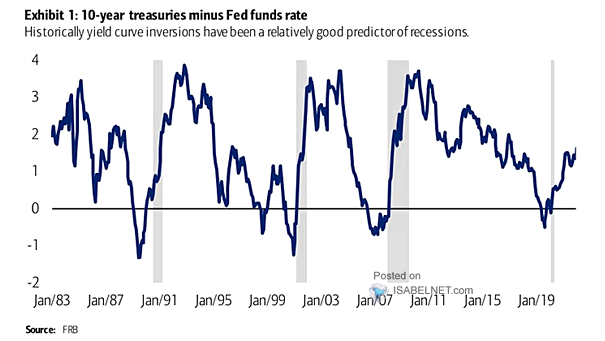
Recession – 10-Year U.S. Treasuries Minus Fed Funds Rate Historically, an inverted yield curve has been an excellent predictor of recessions in the United States. Image: BofA Global Research
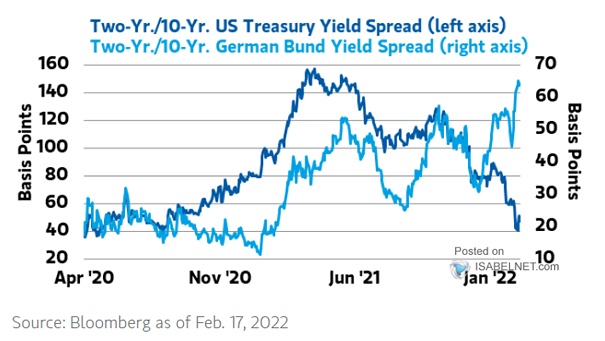
Yield Curve – 2Y/10Y U.S. Treasury Yield Spread and 2Y/10Y German Treasury Yield Spread The U.S. and German yield curves are decoupling, suggesting a slower economic activity in the United States. Image: Morgan Stanley Wealth Management
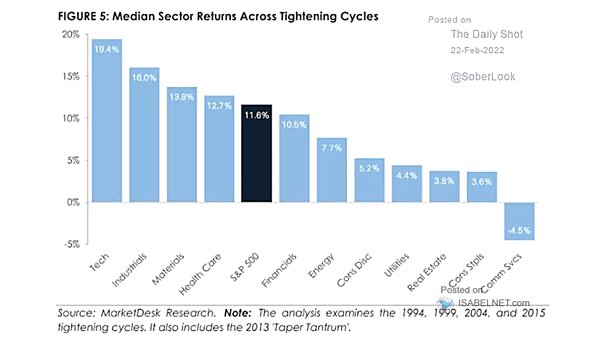
Median Sector Returns Across Tightening Cycles Historically, S&P 500 returns tend to be positive during tightening cycles. Image: MarketDesk Research
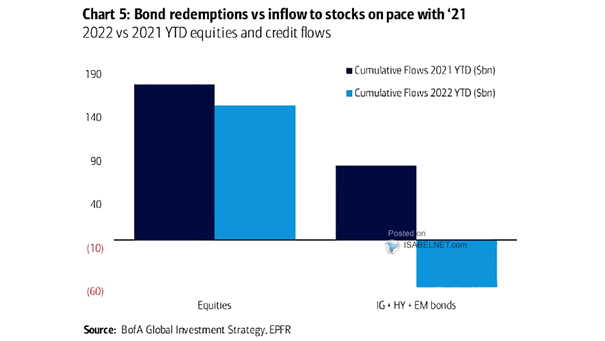
Equities and Credit Flows Flows into equities remain strong this year. Image: BofA Global Investment Strategy