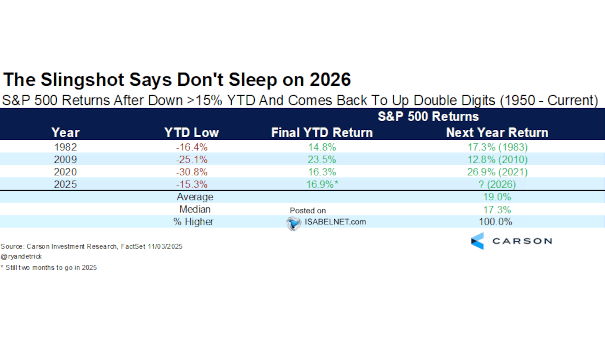
S&P 500 Returns After Five Month Win Streaks

S&P 500 Returns After Five Month Win Streaks History is on the bulls’ side: going back to 1950, five-month winning streaks in the S&P 500 have led to gains 93.3% of the time over the following year, with an average return of 12.6%. Image: Carson Investment Research

Dow Jones Industrial Average Around First Fed Rate Cut

Dow Jones Industrial Average Around First Fed Rate Cut In the absence of recession, U.S. equities typically perform strongly in the year after the Fed’s first rate cut, with cyclical sectors benefiting most from improved financial conditions and economic expansion. Image: Ned Davis Research

U.S. Equity Sentiment Indicator vs. Rolling 6-Month S&P 500 Return

U.S. Equity Sentiment Indicator vs. Rolling 6-Month S&P 500 Return While Goldman Sachs’ U.S. Equity Sentiment Indicator sits at -0.3, investors still have cash to put to work, leaving room for a cautiously bullish outlook in the near term. Image: Goldman Sachs Global Investment Research

Gold in Real Terms Since 1969

Gold in Real Terms Since 1969 Gold’s historically high real price today contrasts with the late-1990s dot-com bubble, when investor optimism sent money pouring into tech stocks, draining demand for gold and pushing its real price sharply lower. Image: Deutsche Bank

MOVE Index vs. S&P 500 Equal-Weighted

MOVE Index vs. S&P 500 Equal-Weighted The performance of the average S&P 500 stock is tightly linked to interest rate swings. When uncertainty over rates rises, investors reassess risk, often driving sharper price moves. Image: Deutsche Bank Asset Allocation

Consecutive Trading Days Without a 2% Drop in the S&P 500

Consecutive Trading Days Without a 2% Drop in the S&P 500 While the S&P 500’s 108-session run without a 2% drop is striking, history offers several precedents of calm periods that were just as long—or even longer. Image: Bloomberg

Bloomberg Dollar Spot Index vs. S&P 500 Index

Bloomberg Dollar Spot Index vs. S&P 500 Index U.S. equities have surged to record highs, even as the dollar remains under pressure amid mixed economic signals and policy shifts. Image: Bloomberg

Foreign Investor Ownership Share of U.S. Equity Market

Foreign Investor Ownership Share of U.S. Equity Market With foreign investors holding a record 18% of U.S. stocks, future investment may be tested by changing trade policies and global economic uncertainties. Image: Goldman Sachs Global Investment Research

Full-Year Real GDP Growth

Full-Year Real GDP Growth Trade barriers, shifting immigration policies, and broader uncertainty are expected to keep the U.S. economy from reaching its potential this year, despite ongoing technological investments. Image: Goldman Sachs Global Investment Research

S&P 500 Market Cap vs. Equal Weighted Returns

S&P 500 Market Cap vs. Equal Weighted Returns Since the March–April correction, most of the gains have come from the largest stocks, which is clear from the difference between equal-weighted and market-cap-weighted S&P 500 indexes. Image: Real Investment Advice

Truck Tonnage vs. S&P 500 Index

Truck Tonnage vs. S&P 500 Index The Truck Tonnage Index rose 0.9% in August. Trucks represent 72.7% of U.S. freight and serve as a barometer of the U.S. economy. This chart shows that, historically, the U.S. stock market has tended to increase in line with the physical size and expansion of the U.S. economy (R²…