Seasonality – S&P 500 Value vs. Growth (Monthly Average Returns)
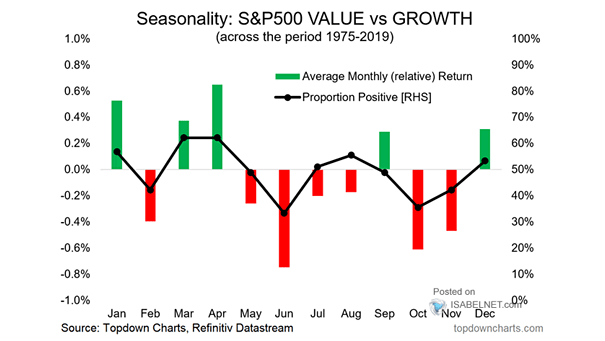
Seasonality – S&P 500 Value vs. Growth (Monthly Average Returns) Historically, returns for Value vs. Growth tend to be negative in February. Image: Topdown Charts
Seasonality – S&P 500 Value vs. Growth (Monthly Average Returns) Historically, returns for Value vs. Growth tend to be negative in February. Image: Topdown Charts
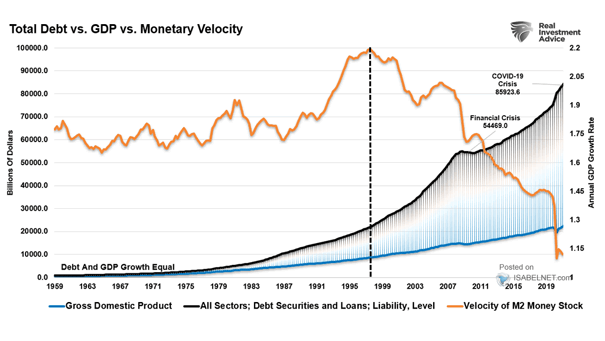
Total Debt vs. U.S. GDP vs. Monetary Velocity The rise in debt has coincided with a collapse in M2 velocity. Image: Real Investment Advice
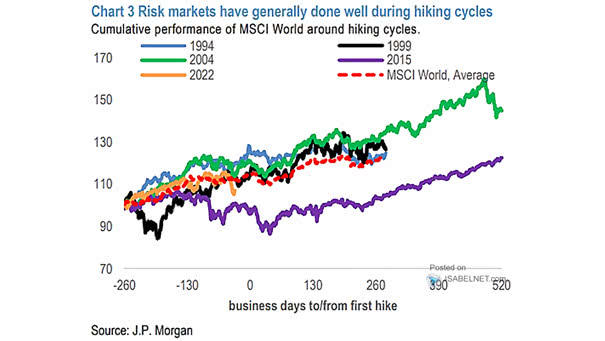
Cumulative Performance of MSCI World Around Hiking Cycles Historically, global equity markets have performed well during hiking cycles. Image: J.P. Morgan
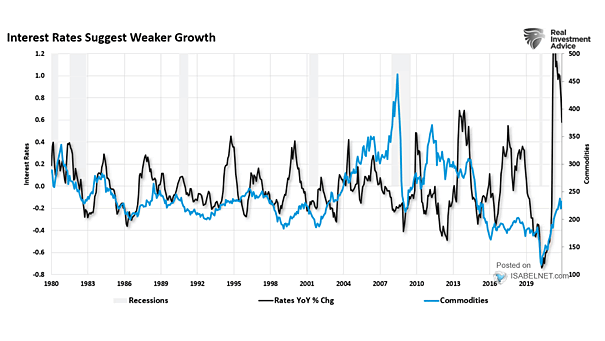
Interest Rates and Commodity Prices Commodity prices and interest rates have an inverse relationship. Is the commodity run over? Image: Real Investment Advice
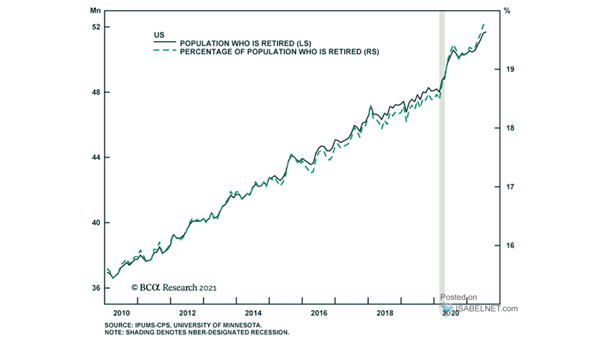
U.S. Population Who Is Retired The coronavirus pandemic is pushing more Americans into retirement. Image: BCA Research
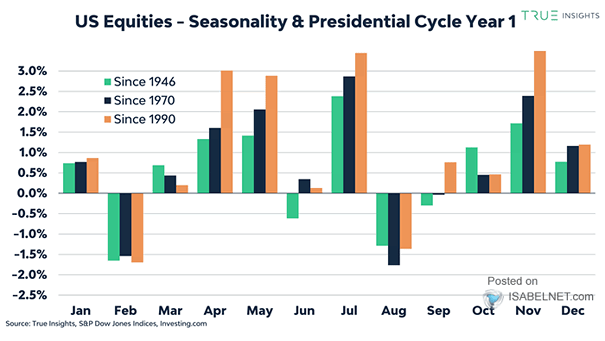
U.S. Equities – Seasonality and Presidential Cycle Year 1 Will February 2022 be a challenging month for U.S. equities? Image: True Insights
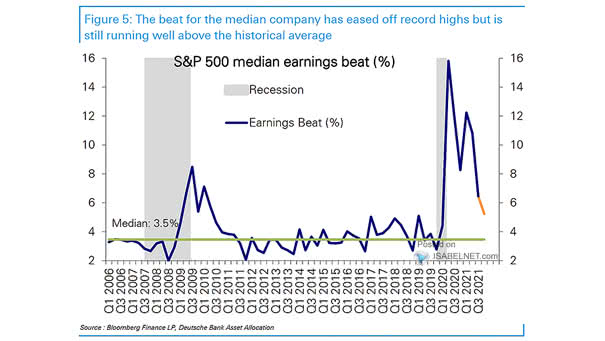
S&P 500 Median Earnings Beat The earnings beat for the median S&P 500 company remains above the historical average. Image: Deutsche Bank Asset Allocation
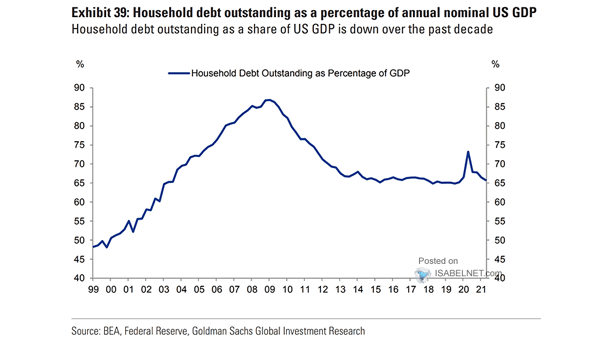
U.S. Household Debt Outstanding as a Percentage of Annual Nominal GDP U.S. household debt as a percentage of nominal GDP remains stable. Image: Goldman Sachs Global Investment Research
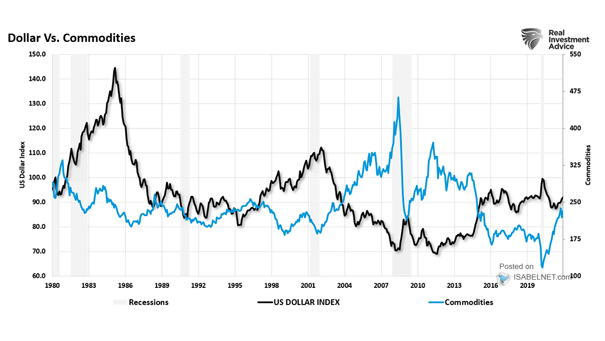
U.S. Dollar Index vs. Commodities A strong U.S. dollar tends to be bearish for commodities. Image: Real Investment Advice
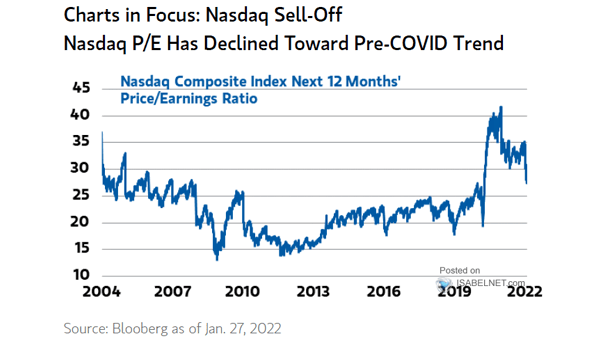
Valuation – Nasdaq Composite Index Next 12 Months Price/Earnings Ratio After the January sell-off, the valuation of the Nasdaq is becoming more attractive. Image: Morgan Stanley Wealth Management
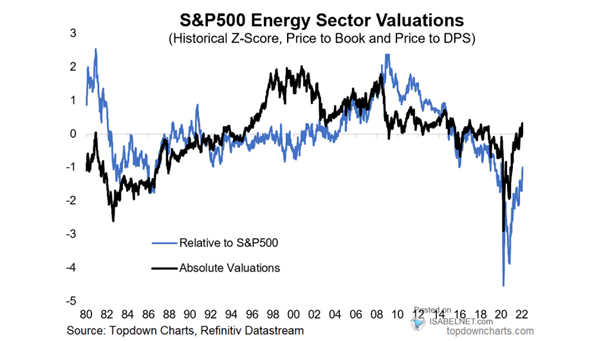
S&P 500 Energy Sector Valuations The valuation of the energy sector remains cheap relative to the S&P 500. Image: Topdown Charts