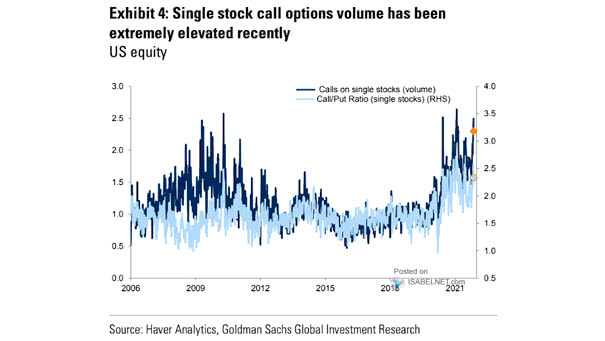
Number of S&P 500 Companies Citing Inflation on Earnings Calls
Number of S&P 500 Companies Citing Inflation on Earnings Calls S&P 500 company mentions of “inflation” jump to record levels. Image: Morgan Stanley Wealth Management
Equities as Share of Total Household Financial Assets U.S. households are loaded with equities. Will this end well? Image: BCA Research
China Excess Reserve Ratio and Credit Impulse (Leading Indicator) Investors should be pleased as Chinese stimulus is on the way. Image: BCA Research
Earnings Revisions Breadth and S&P 500 Price % Above/Below 200-Day Moving Average Earnings revisions have likely peaked. Image: Morgan Stanley Research
Rates – Short Duration vs. Long Duration Indexed Relative to Basket Return and 5-Year, 5-Year Forward Real U.S. Treasury Yield Short vs. long duration tends to track the path of U.S. rates. Image: Goldman Sachs Global Investment Research
Yield Gap – S&P 500 EPS Yield vs. U.S. 10-Year Treasury Yield Relative U.S. equity valuations are still attractive vs. history. Image: Goldman Sachs Global Investment Research
Consumer Confidence Index vs. S&P 500 Does consumer confidence improve or do equities fall? Image: Piper Sandler
S&P 500 Drawdowns – Fastest Recovery in History from 2-Sigma This year, the S&P 500’s average recovery time of 4.6 days is at the lowest level since 1928. How long can this last? Image: BofA Global Research
S&P 500 – Duration Between Two 3%+ Drawdowns Is the U.S. stock market poised for a bigger drawdown before the end of the year? Image: Deutsche Bank Global Asset Allocation
Valuation – Cyclically-Adjusted P/E Why are U.S. equities more expensive than other developed markets? Image: BCA Research
Net % Overweight Equities vs. Global PMI Momentum Global PMI momentum is expected to turn negative over the coming months. Image: BofA Global Research