U.S. 30-Year Fixed Mortgage Rates
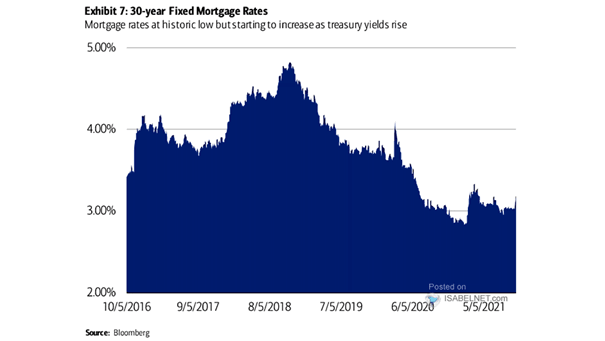
U.S. 30-Year Fixed Mortgage Rates With Treasury yields rising, are ultra-low mortgage rates over? Image: BofA Global Research
U.S. 30-Year Fixed Mortgage Rates With Treasury yields rising, are ultra-low mortgage rates over? Image: BofA Global Research
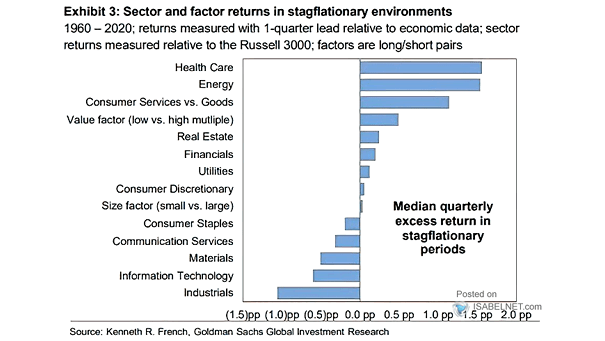
Median Quarterly Excess Return in Stagflationary Periods Health care and energy tend to outperform in stagflationary environments. Image: Goldman Sachs Global Investment Research
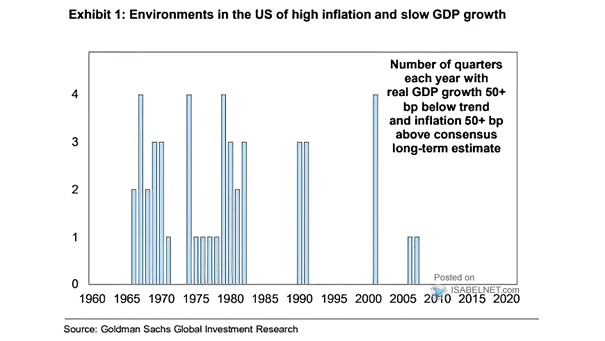
Environments in the U.S. of High Inflation and Slow GDP Growth Are investors at risk of stagflation as inflation rises and GDP growth slows? Image: Goldman Sachs Global Investment Research
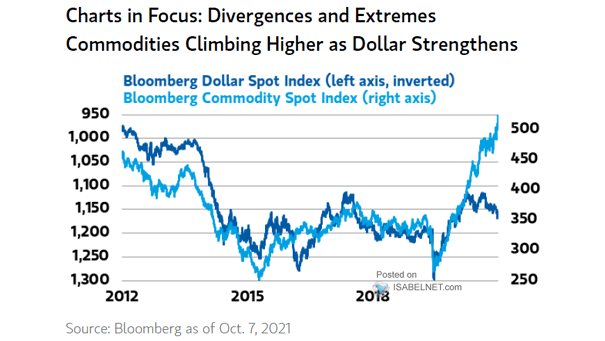
U.S. Dollar Index vs. Commodities Can commodities withstand a stronger U.S. dollar? Image: Morgan Stanley Wealth Management
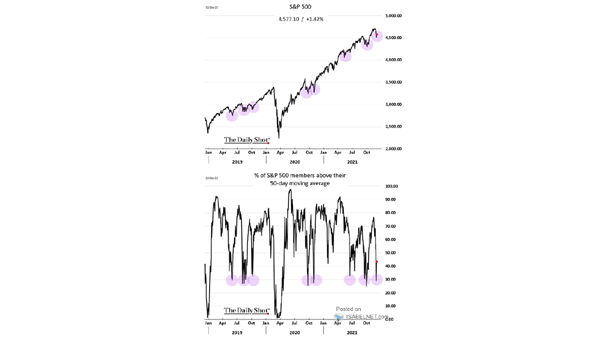
S&P 500 and % of S&P 500 Members Above their 50-Day Moving Average Could the number of S&P 500 members above their 50-day moving average be good news for U.S. stocks? Image: The Daily Shot
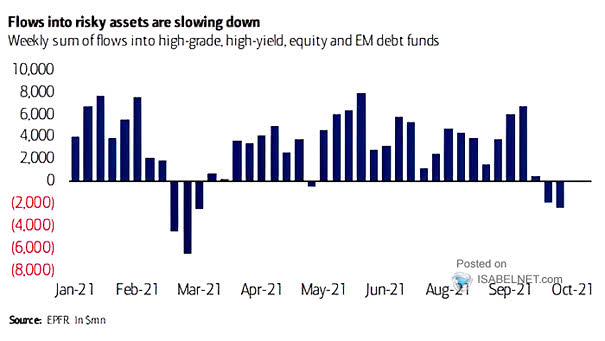
Weekly Sum of Flows into High Grade, High Yield, Equity and EM Debt Funds Are outflows from risky assets temporary? Image: BofA ETF Research
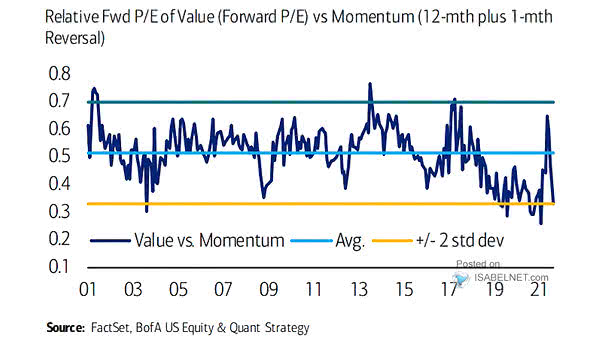
Relative Forward P/E of Value vs. Momentum Is it time for investors to favor value stocks? Image: BofA US Equity & Quant Strategy
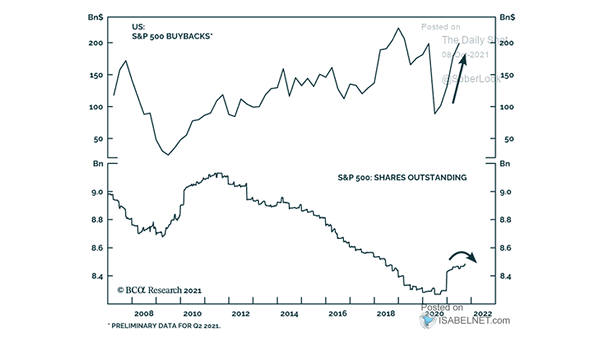
S&P 500 – Buybacks and Shares Outstanding Stock buybacks are making a strong comeback this year as the economy recovers from the pandemic. Image: BCA Research
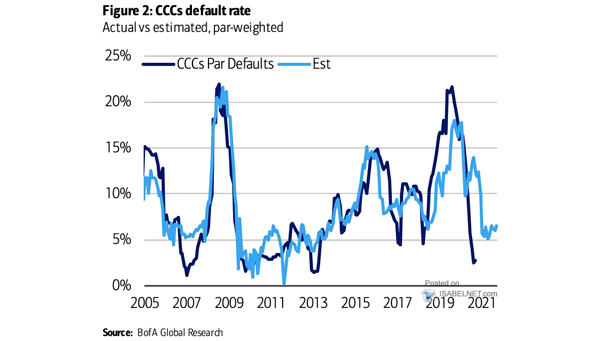
CCCs Default Rate No defaults among CCC-rated companies in the last three months. Is the price of risk too low in this market? Image: BofA Global Research
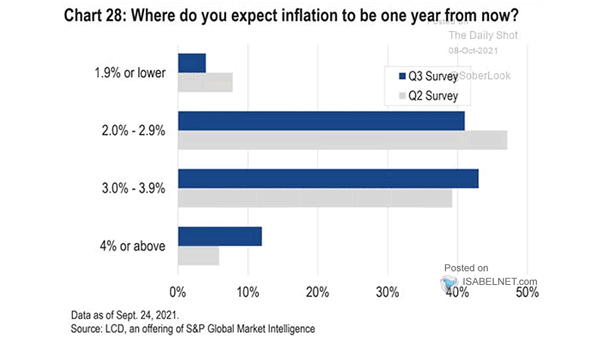
Survey – Where Do You Expect Inflation to Be One Year from Now? Are investors right about the level of inflation in one year? Image: S&P Global Market Intelligence
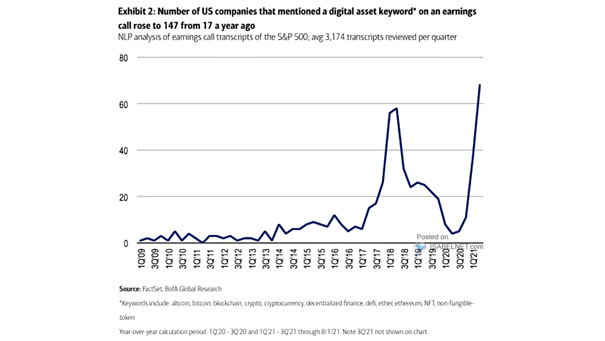
Number of U.S. Companies that Mentionned a Digital Asset Keyword on an Earnings Call Will U.S. companies interest in digital assets continue to grow? Image: BofA Global Research