Valuation – PEG Ratio between U.S. and Europe
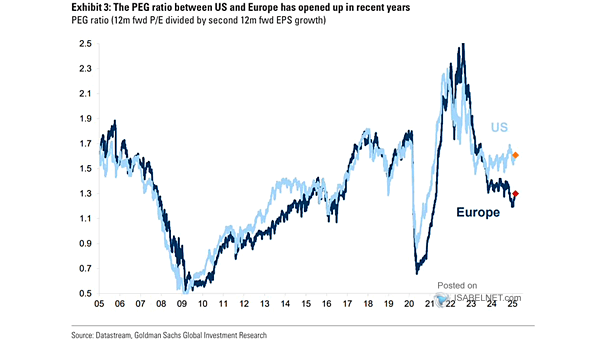
Valuation – PEG Ratio between U.S. and Europe As equity returns broaden in 2025, the PEG ratio gap between the U.S. and the rest of the world is narrowing. This convergence in growth-adjusted valuations is likely to extend into 2026, even if U.S. valuations remain lofty. Image: Goldman Sachs Global Investment Research