Gold Price and U.S. Real Yields (Inverted)
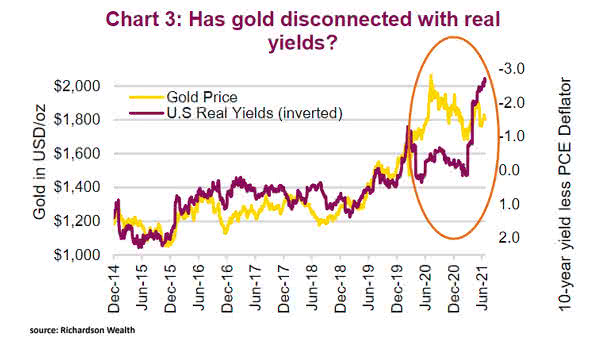
Gold Price and U.S. Real Yields (Inverted) Has gold lost some of its lustre? Image: Richardson Wealth
Gold Price and U.S. Real Yields (Inverted) Has gold lost some of its lustre? Image: Richardson Wealth
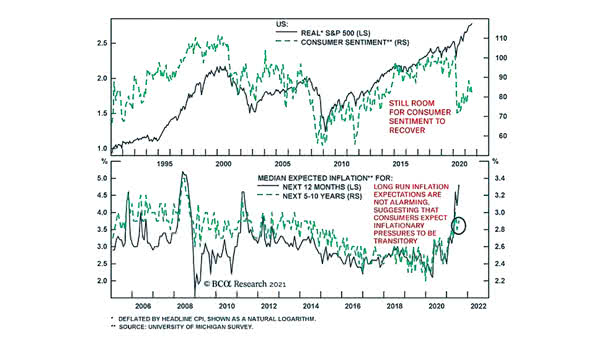
Real S&P 500 and U.S. Consumer Sentiment and Median Expected Inflation U.S. consumer sentiment remains weak as inflation could dampen the economic recovery and consumer spending. Image: BCA Research
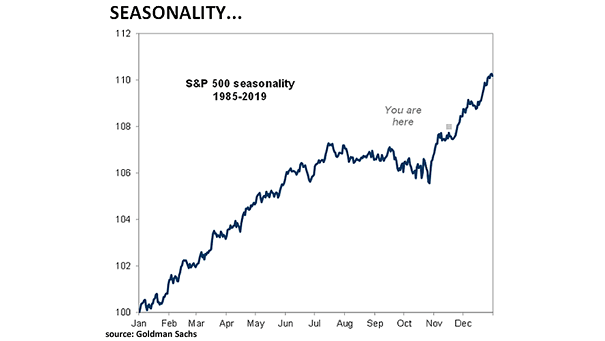
S&P 500 Seasonality Since 1985 Chart showing the S&P 500 seasonality from 1985 to 2019. This is not a forecast. Image: Goldman Sachs Global Investment Research
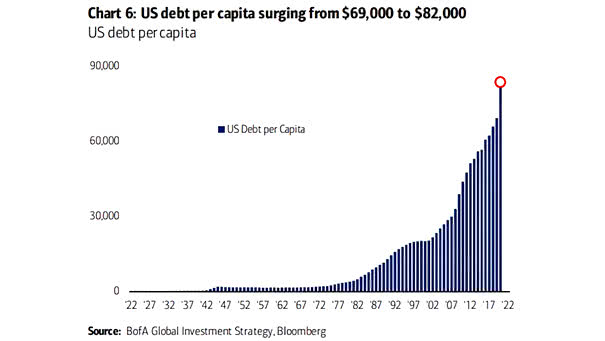
U.S. Debt per Capita U.S. debt per capita is surging, reaching the current level of $82,000. Image: BofA Global Research
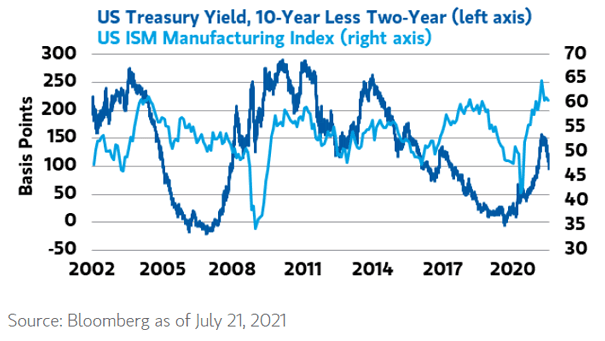
U.S. 10Y-2Y Treasury Yield Curve and U.S. ISM Manufacturing Index In a situation of extreme excess liquidity, is the U.S. 10Y-2Y yield curve a broken indicator? Image: Morgan Stanley Wealth Management
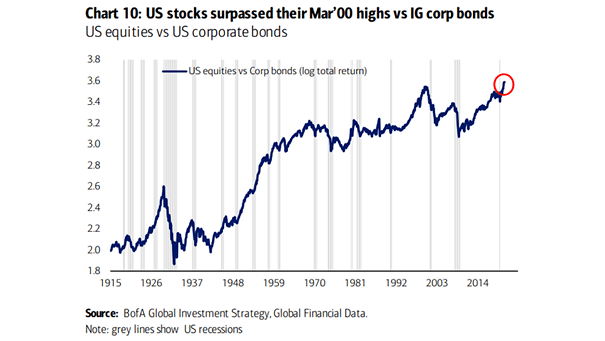
Total Return – U.S. Equities vs. U.S. Corporate Bonds Should investors favor investment grade corporate bonds over U.S. stocks? Image: BofA Global Investment Strategy
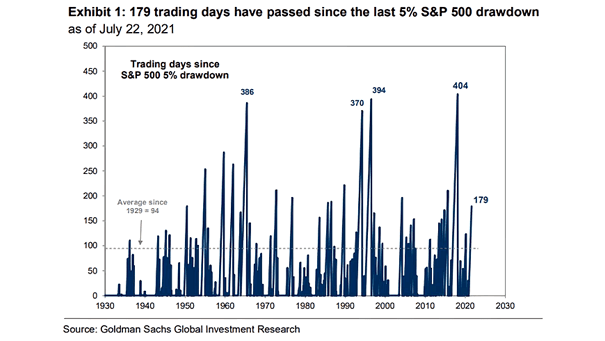
Trading Days Since S&P 500 5% Drawdown Is the S&P 500 poised for a 5% drawdown or more at some point this year? Image: Goldman Sachs Global Investment Research
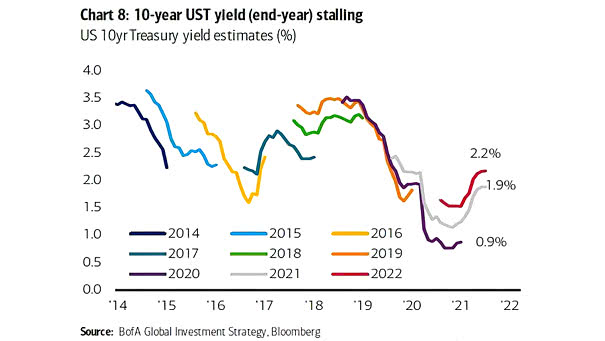
U.S. 10-Year Treasury Yield Estimates While U.S. stocks rise to all-time highs, U.S. 10-year Treasury yield estimates are stalling. Image: BofA Global Investment Strategy
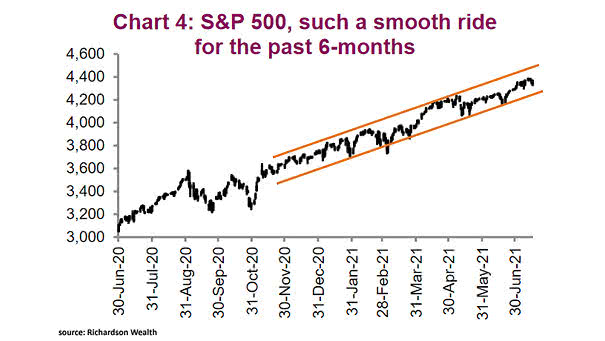
S&P 500 for the Past 6 Months The longer the quiet period, the more violent the volatility and fluctuations in the market. Image: Richardson Wealth
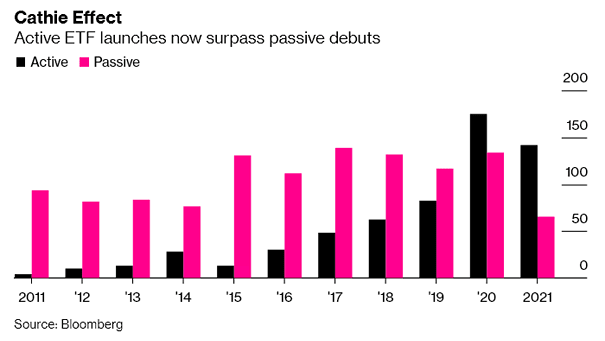
Active vs. Passive ETFs Will actively managed ETFs continue to shine in 2021? Image: Bloomberg
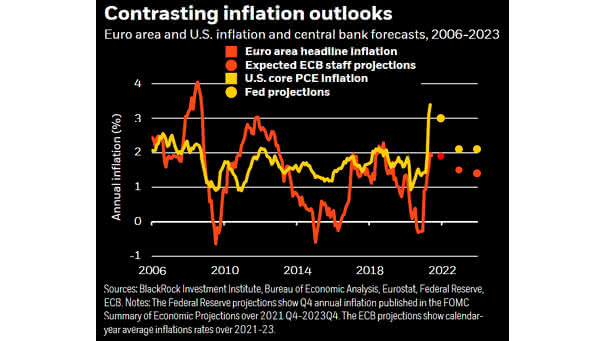
Euro Area and U.S. Inflation and Central Bank Forecasts The Fed projects U.S. inflation well above 2% into 2023. Image: BlackRock Investment Institute