U.S. Dollar Index (DXY) and DXY Weighted 2-Year Rate Differential
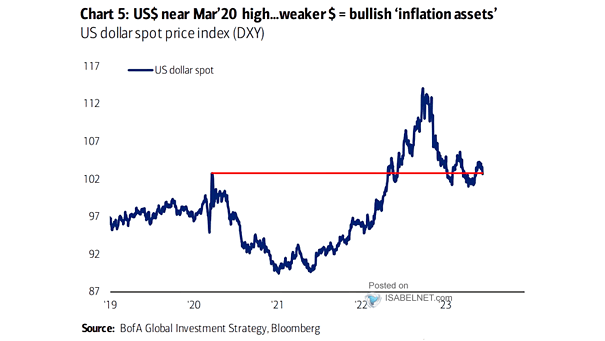
U.S. Dollar Index (DXY) and DXY Weighted 2-Year Rate Differential The U.S. dollar’s recent gains have been surprisingly modest, given the backdrop. In fact, rate differentials still argue for a softer greenback. Image: TS Lombard