Valuation – S&P 500 12-Month Forward P/E
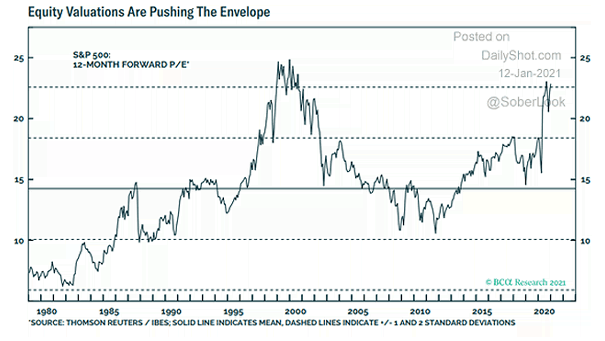
Valuation – S&P 500 12-Month Forward P/E The S&P 500 looks expensive by historical standards. Image: BCA Research
Valuation – S&P 500 12-Month Forward P/E The S&P 500 looks expensive by historical standards. Image: BCA Research
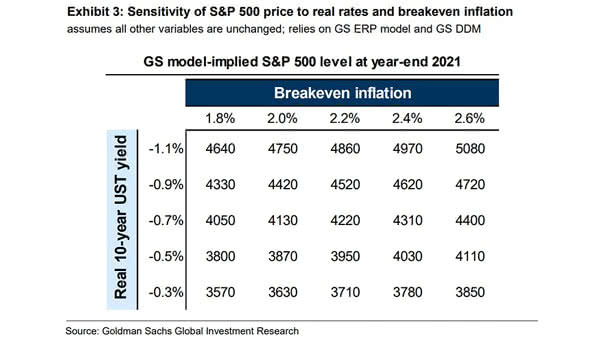
Sensitivity of S&P 500 Price to Real Rates and Breakeven Inflation Goldman Sachs expects breakeven inflation will continue to rise. The year-end S&P 500 price targets of 4300 this year and 4600 in 2022 remain unchanged. Image: Goldman Sachs Global Investment Research
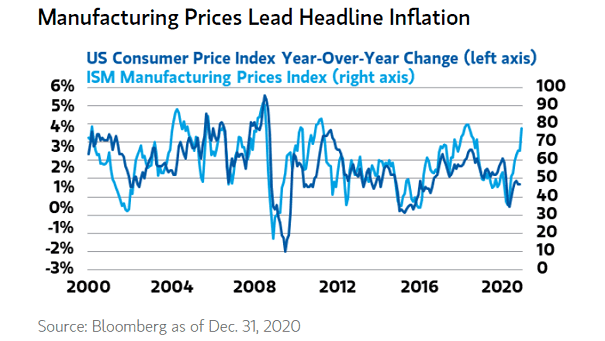
Inflation – U.S. Consumer Price Index and ISM Manufacturing Prices Index (Leading Indicator) ISM manufacturing prices tend to lead headline inflation. Image: Morgan Stanley Wealth Management
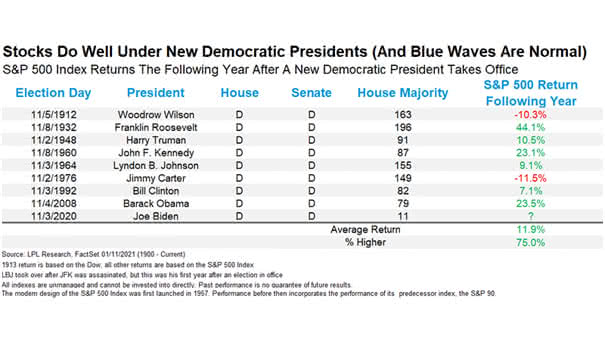
S&P 500 Index Returns the Following Year After a New Democratic President Takes Office It’s officially a blue wave. Historically, the S&P 500 tends to do well under new Democratic presidents. Image: LPL Research
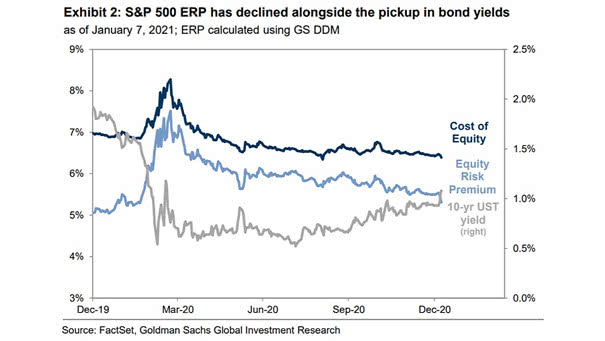
S&P 500 Equity Risk Premium (ERP) Goldman Sachs forecasts the ERP will fall to 4.6% this year and 4.3% in 2022. Image: Goldman Sachs Global Investment Research
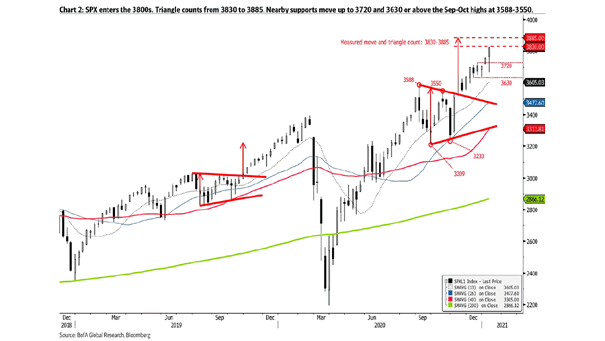
S&P 500 Trading Cycle Bullish with Rising 26 and 40-Week Moving Averages The rising 26 and 40-week moving averages suggest a bullish trading cycle for the S&P 500. Image: BofA Global Research Click the Image to Enlarge
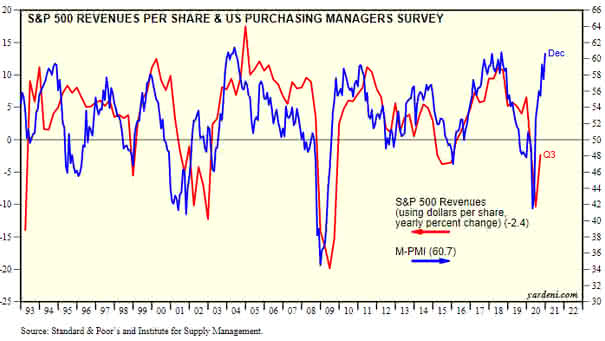
ISM PMI and S&P 500 Revenues per Share (Leading Indicator) The ISM PMI tends to lead S&P 500 revenues. Image: Yardeni Research
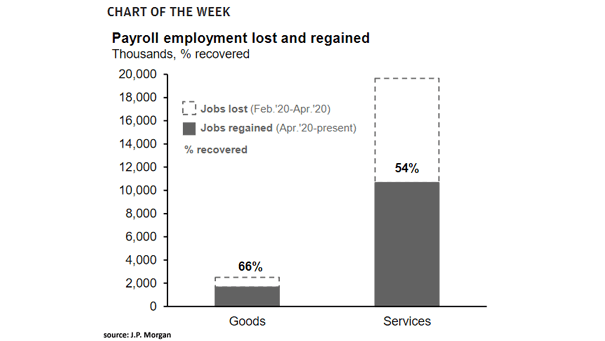
U.S. Jobs – Payroll Employment Lost and Regained The resurgence of the coronavirus pandemic has stalled the U.S. jobs recovery. Image: J.P. Morgan Asset Management
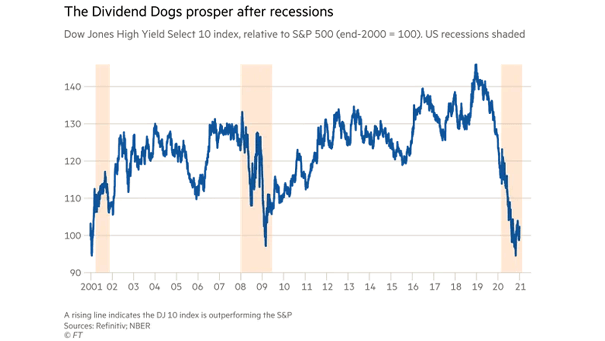
Performance – Dow Jones High Yield Select 10 Index Relative to S&P 500 The Dogs of the Dow (10 highest yielding stocks in the Dow Jones) tend to outperform the S&P 500 after recessions. Image: Financial Times
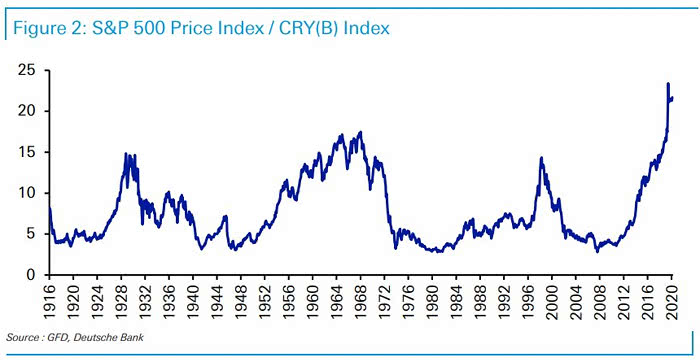
Valuation – S&P 500 vs. Commodities The S&P 500 relative to commodities is trading at the highest valuation level since 1916. Image: Deutsche Bank
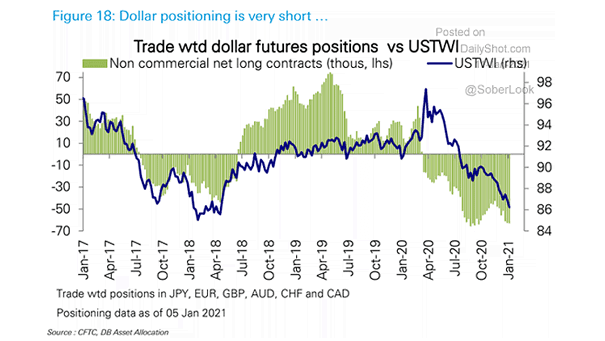
Trade Weighted Dollar Futures Positions vs. USTWI Should investors expect a rebound in the U.S. dollar? Image: Deutsche Bank Asset Allocation