S&P 500 and Global Central Bank Rate Cuts

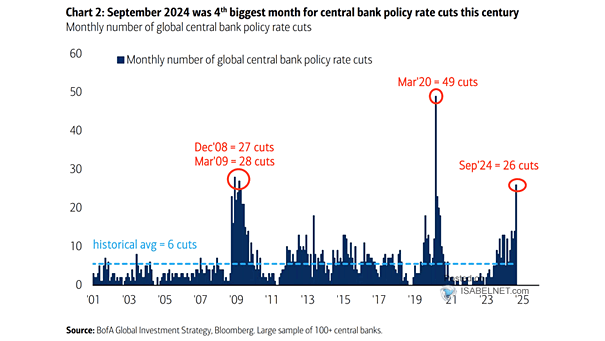
S&P 500 and Global Central Bank Rate Cuts With most central banks cutting rates or holding steady over the past six months, the easy policy mood has helped lift risk appetite and pushed markets like the S&P 500 higher. Image: Bloomberg

Real S&P 500 Index with Recessions and S&P 500 Shiller CAPE Ratio

Valuation – Real S&P 500 Index with Recessions and S&P 500 Shiller CAPE Ratio Markets move in full cycles, swinging from long bull runs to deep bear phases. These patterns have played out time and again through history and remain essential to grasp for anyone focused on long-term investing. Image: Real Investment Advice

S&P 500 Annual Highs Per Month

S&P 500 Annual Highs Per Month It’s still a bull market to love, even as the bears grow louder. History rarely sees the S&P 500 peak in October, and with new highs within reach, U.S. stocks may still have more room to run. Image: Carson Investment Research

Equities – 10-Year Forward Annualized Total Returns in Local Currency

Equities – 10-Year Forward Annualized Total Returns in Local Currency Rich valuations aren’t stopping Goldman Sachs from backing global equities, with Emerging Markets and Asia seen leading performance over the next 10 years. Image: Goldman Sachs Global Investment Research

Mentions of AI During Earnings Calls

Mentions of AI During Earnings Calls AI is taking center stage in corporate America, with an increasing number of S&P 500 companies spotlighting it in their earnings calls, and the momentum shows no signs of slowing. Image: Goldman Sachs Global Investment Research

S&P 500 Returns When New Highs Are Made In October

S&P 500 Returns When New Highs Are Made In October A slow start to November may not tell the whole story. When the S&P 500 hits a new high in October, history leans bullish, with the index averaging 3.5% over November and December and finishing higher nearly nine times out of ten. Image: Carson Investment…

Citi U.S. Earnings Revision Index and S&P 500 Index

Citi U.S. Earnings Revision Index and S&P 500 Index The S&P 500’s bull market remains firmly in place, with upside potential into 2026 fueled by earnings upgrades and upbeat corporate guidance. Image: Bloomberg

Margin Debt to U.S. Market Cap

Margin Debt to U.S. Market Cap While margin debt has been rising, its share of total U.S. market value still sits at manageable levels. That keeps leverage risks in check and suggests investors could take on more borrowing if equities keep their momentum. Image: Bloomberg

S&P 500 After Four Months Above the 50-Day MA Ends

S&P 500 After Four Months Above the 50-Day MA Ends A break below the 50-day moving average after four months of strength might set off alarm bells, but history has usually rewarded patience. The S&P 500 index has gained roughly 10% a year later since 1950. Image: Carson Investment Research