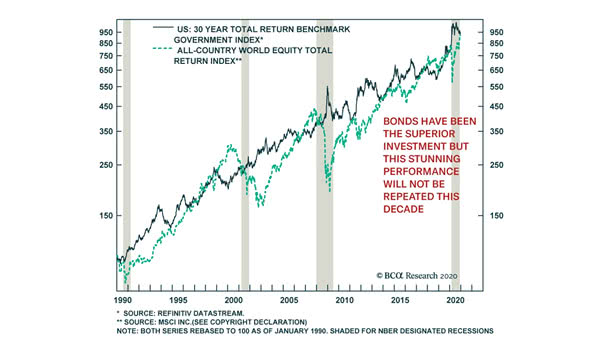
Single Stock Liquidity

Single Stock Liquidity Single stock liquidity is improving since March, but remains below average levels. Image: Goldman Sachs

S&P 500 and Bullish Triangle Pattern

S&P 500 and Bullish Triangle Pattern The bullish triangle pattern could suggest 3800s into early 2021 for the S&P 500. Image: BofA Global Research

Economies in Recession

Economies in Recession This year is ending with 93% of the world’s economies contracting, with 53% shrinking by more than 6%. Image: BofA Global Research

IPO Market in the U.S.

IPO Market in the U.S. The U.S. IPO market heats up in 2020, but more unprofitable companies are going public. Image: Bloomberg

2020 Inflows: Equities, Bonds, Cash and Gold

2020 Inflows: Equities, Bonds, Cash and Gold There is still a lot of cash on the sideline, which could be put to work in the market. Image: BofA Global Investment Strategy

Inflows as % of Assets Under Management (AUM)

Inflows as % of Assets Under Management (AUM) Cash, gold and tech are the largest inflows this year, amid the coronavirus pandemic. Image: BofA Global Investment Strategy