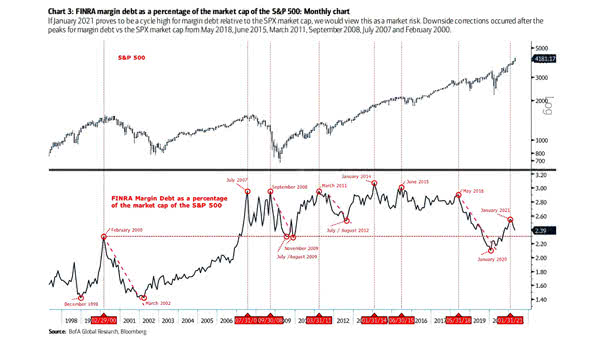
NYSE Margin Debt and S&P 500
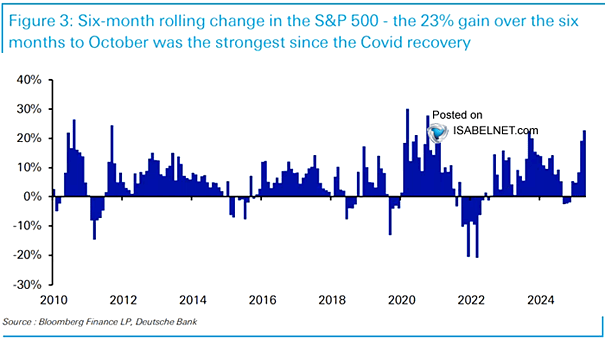
NYSE Margin Debt and S&P 500 Margin debt on the NYSE has seen the second fastest spike on record over the past six months. Spikes in margin debt at a much faster pace than broad market returns have sometimes preceded market peaks. Image: Deutsche Bank