World Oil and Gas: Dividends per Share
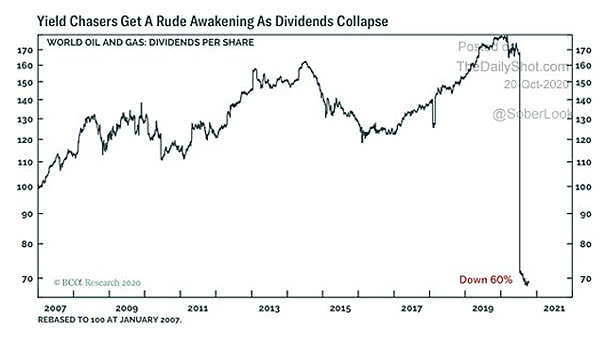
World Oil and Gas: Dividends per Share The ongoing collapse of dividends is unprecedented. Image: BCA Research
World Oil and Gas: Dividends per Share The ongoing collapse of dividends is unprecedented. Image: BCA Research
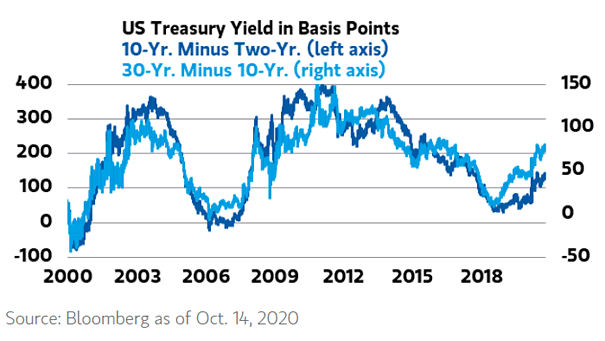
U.S. Treasury Yield – 10Y-2Y vs. 30Y-10Y Morgan Stanley forecasts the 10-year Treasury yield at about 1% by the end of the year. Image: Morgan Stanley Wealth Management
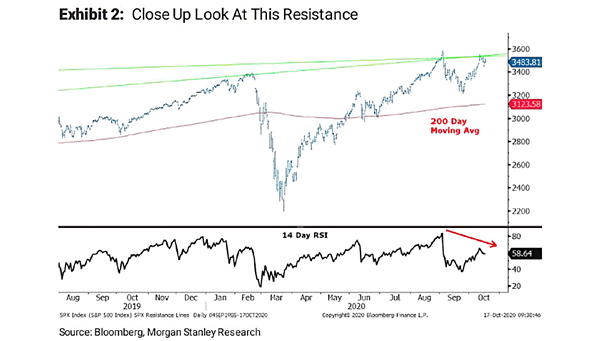
S&P 500 Key Support at the 200-Day Moving Average According to Morgan Stanley, the correction that began in September is likely not complete. Morgan Stanley sees the 200-day moving average as a strong support. Image: Morgan Stanley Research
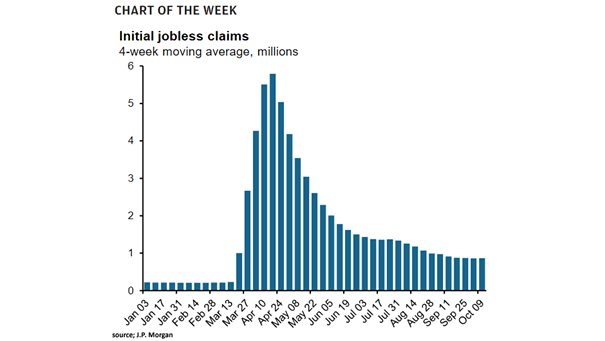
U.S. Labor Market – Initial Jobless Claims The four-week moving average of jobless claims ticked higher, suggesting that the road to recovery is a long journey. Image: J.P. Morgan Asset Management
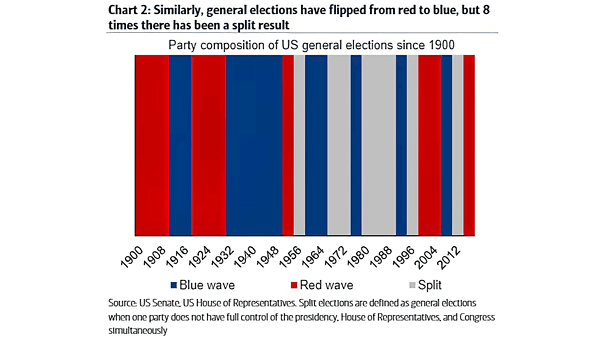
Party Composition of U.S. General Elections Since 1900 Since 1900, the U.S. general elections have seen 12 blue waves and 10 red waves, but 8 times there has been a split result. Image: BofA
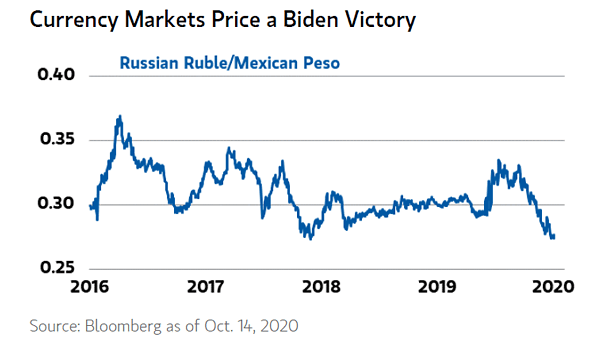
Currency Markets and U.S. Elections FX markets are pricing in a Biden presidency and a blue sweep as well. Image: Morgan Stanley Wealth Management
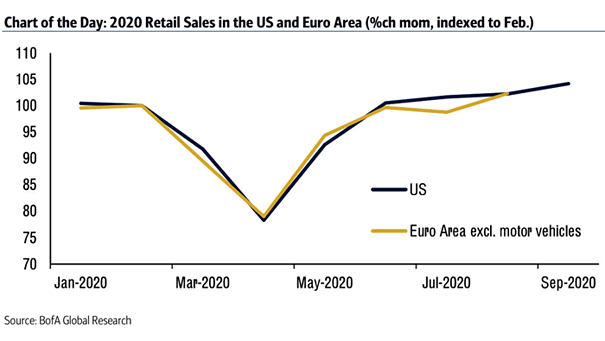
2020 Retail Sales in the U.S. and Euro Area This chart shows a sweet V-shaped recovery in U.S. and EU retail sales. Image: BofA Global Research
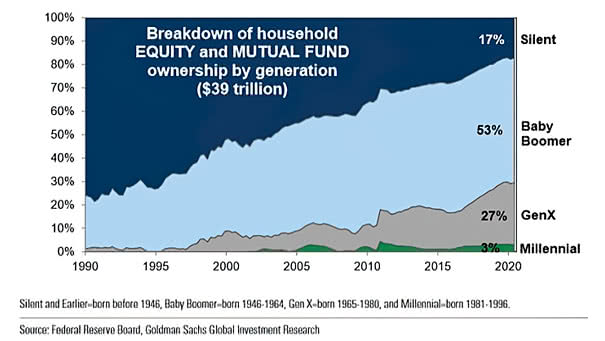
Breakdown of Household Equity and Mutual Fund Ownership by Generation Baby boomers control a substantial proportion of the U.S. equity market. Image: Goldman Sachs Global Investment Research
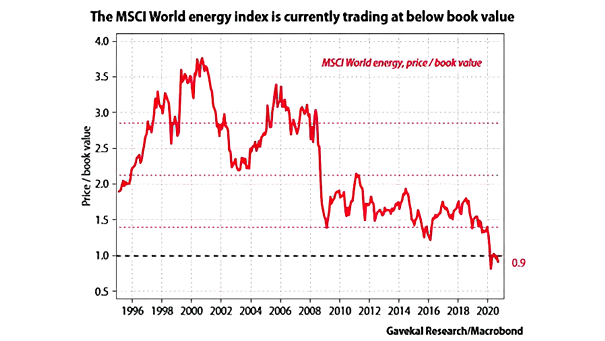
Energy Stocks – MSCI World Energy Index and Book Value Are energy stocks a buying opportunity? Image: Gavekal, Macrobond
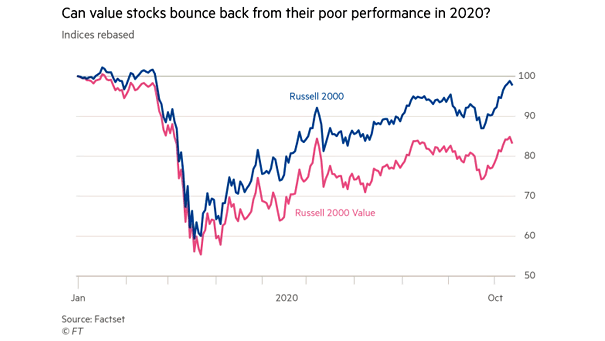
Value Stocks – Russell 2000 vs. Russell 2000 Value Can value stocks bounce back, as Value tends to outperform in the early stages of an economic recovery? Image: Financial Times
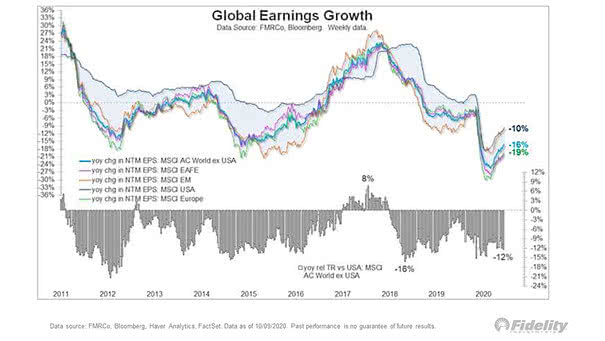
Global EPS – Global Earnings Growth This chart highlights the strong recovery in global earnings growth. Image: Fidelity Investments