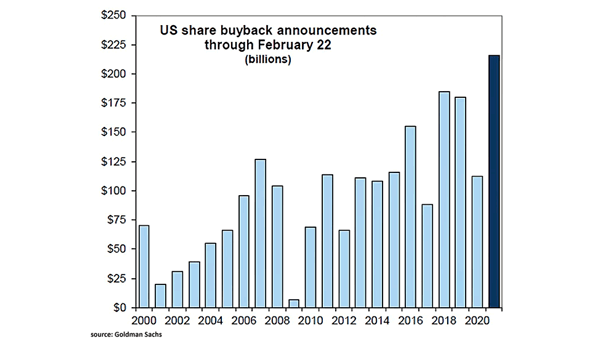
Equities – Global Valuation Range

Equities – Global Valuation Range U.S. stocks remain priced at a hefty premium, while valuations outside the U.S. are closer to historical norms. That leaves global markets offering stronger relative value, even if they’re not a bargain in absolute terms. Image: Goldman Sachs Global Investment Research

S&P 500 Compared to Its 200-Day Moving Average

S&P 500 Compared to Its 200-Day Moving Average With the S&P 500 sitting 10% above its 200-day moving average, the market looks firmly bullish, suggesting more upside potential until a local peak around 13–15% above the 200-dma—roughly 6,950—comes into play. Image: Fundstrat Global Advisors, LLC

S&P 500 Quarterly Returns

S&P 500 Quarterly Returns Seasonality tends to favor the bulls into year-end. Going back to 1950, the S&P 500 has gained more than 4% on average in the fourth quarter, posting positive returns 80% of the time. Image: Carson Investment Research

Scatter Plot Returns of P/E Multiples and S&P 500 1-Year Returns

Scatter Plot Returns of P/E Multiples and S&P 500 1-Year Returns The weak link between the P/E ratio and the S&P 500’s one-year performance shows why investors are better off keeping their eyes on the long game, not short-term valuations. Image: Carson Investment Research

S&P 500 and Nasdaq vs. 1996-2001 Analog

S&P 500 and Nasdaq vs. 1996-2001 Analog With policy easing expected to run into 2026, will U.S. equities continue to mirror the boom years of 1996 to 2001? Image: Alpine Macro

U.S. High Yield Credit Spreads

U.S. High Yield Credit Spreads Tight high-yield spreads signal strong market confidence, but they also raise red flags by potentially masking underlying vulnerabilities and feeding investor complacency by making risks seem less significant than they are. Image: Topdown Charts

Underlying U.S. Real GDP Growth

Underlying U.S. Real GDP Growth The AI-driven tech boom has kept the U.S. economy from slipping into recession in 2025, but whether the rally can last is far from certain—and a pullback in investment could quickly tip the balance. Image: Deutsche Bank Research

Asset Bubbles – Bitcoin, Equities and Bonds

Asset Bubbles – Bitcoin, Equities and Bonds While caution is always warranted and some assets look frothy, extreme market bubbles are not apparent right now—though pockets of overvaluation do remain. Image: Deutsche Bank Research

S&P 500 Returns After Five Month Win Streaks

S&P 500 Returns After Five Month Win Streaks History is on the bulls’ side: going back to 1950, five-month winning streaks in the S&P 500 have led to gains 93.3% of the time over the following year, with an average return of 12.6%. Image: Carson Investment Research

Dow Jones Industrial Average Around First Fed Rate Cut

Dow Jones Industrial Average Around First Fed Rate Cut In the absence of recession, U.S. equities typically perform strongly in the year after the Fed’s first rate cut, with cyclical sectors benefiting most from improved financial conditions and economic expansion. Image: Ned Davis Research

U.S. Equity Sentiment Indicator vs. Rolling 6-Month S&P 500 Return

U.S. Equity Sentiment Indicator vs. Rolling 6-Month S&P 500 Return While Goldman Sachs’ U.S. Equity Sentiment Indicator sits at -0.3, investors still have cash to put to work, leaving room for a cautiously bullish outlook in the near term. Image: Goldman Sachs Global Investment Research