200-Day Moving Average of FAAMG Stocks
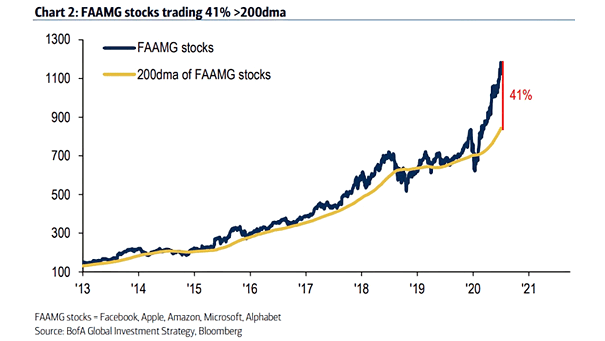
200-Day Moving Average of FAAMG Stocks Trading at 41% above the 200-day moving average appears stretched, but it’s important not to lose sight of the big picture. Image: BofA Global Investment Strategy
200-Day Moving Average of FAAMG Stocks Trading at 41% above the 200-day moving average appears stretched, but it’s important not to lose sight of the big picture. Image: BofA Global Investment Strategy
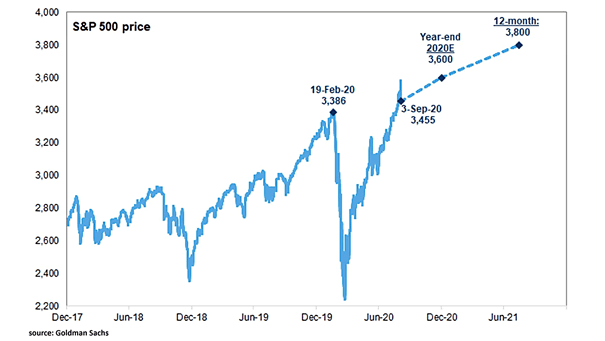
S&P 500 Price Target by the End of 2020 and the Next 12 Months Goldman Sachs maintains its S&P 500 price target to 3600 by the end of 2020, and its 12-month S&P 500 price target to 3800. Image: Goldman Sachs Global Investment Research
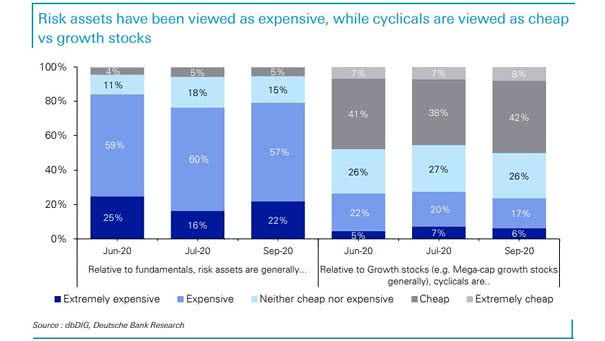
Valuation of Risk Assets (Survey) The results of a survey of 800 global investors show that risk assets are generally viewed as expensive. Image: Deutsche Bank Research
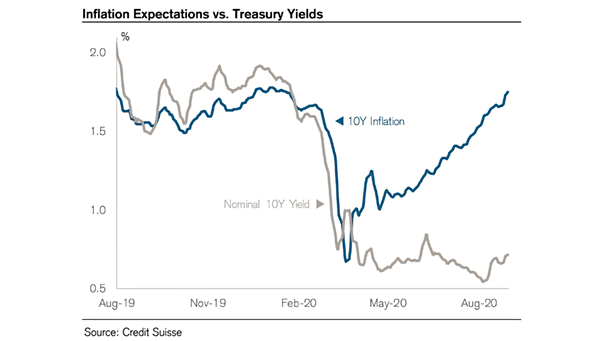
Inflation Expectations vs. Treasury Yields The relationship between Treasury yields and inflation expectations has broken down. Image: Credit Suisse
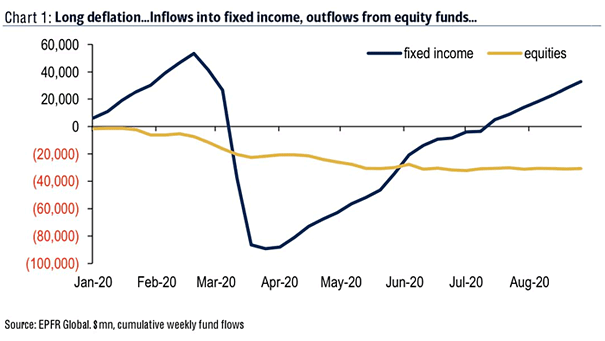
Funds Flow – Fixed Income and Equities Fixed income funds continue to recover, but equity funds experienced 22 weeks of outflows this year. Image: BofA
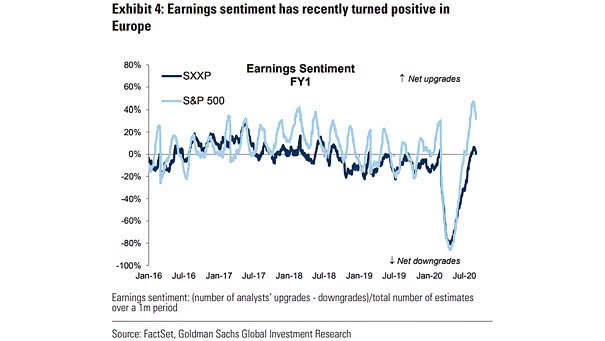
Earnings Sentiment (S&P 500 Index and STOXX Europe 600 Index) Earnings sentiment seems to have peak in the United States. Image: Goldman Sachs Global Investment Research
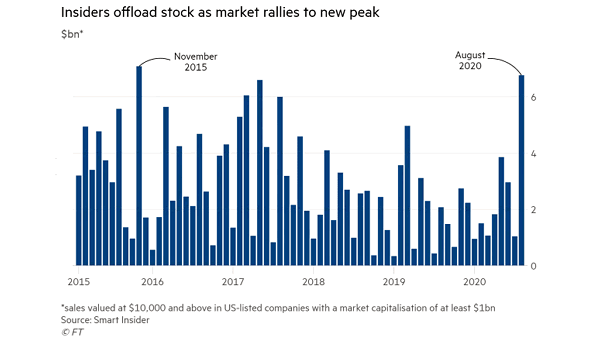
Insiders Sales in U.S. Listed Companies Last month, U.S. executives sold stocks in their own companies as the S&P 500 rallies on. This is the biggest burst of selling since 2015. Image: Financial Times

S&P 500 Historical Bear Markets and Recoveries since 1929 The all-time high came after a recovery from the shortest bear market in S&P 500 history. Image: Scotiabank GBM Portfolio Strategy
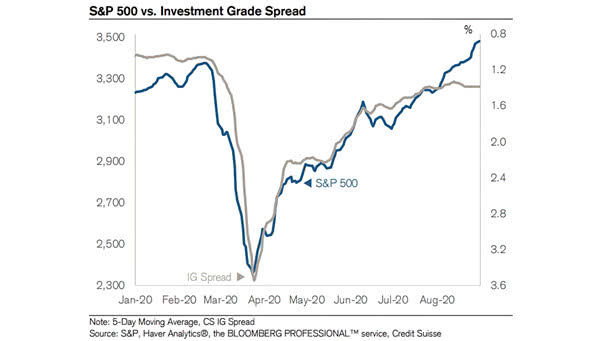
S&P 500 vs. Investment Grade Spread Will the gap close between the S&P 500 and the IG spread? Image: Credit Suisse
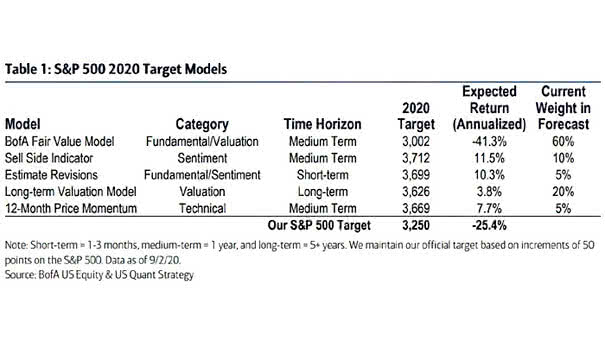
S&P 500 2020 Target Models BofA has raised its S&P 500 price target for 2020 from 2,900 to 3,250, but still below current market levels. Image: BofA US Equity & US Quant Strategy
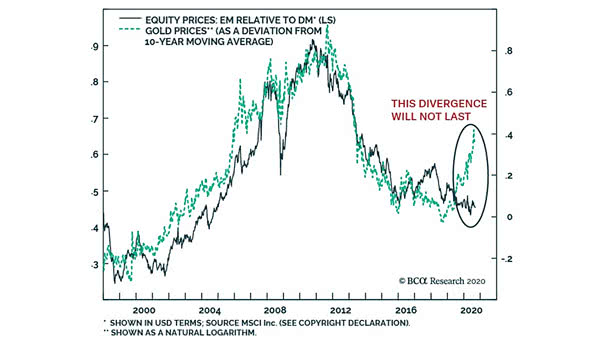
Equity Prices – EM Relative to DM vs. Gold Prices Is the relative performance of emerging market equities vs. developed market equities at a major market turning point? Image: BCA Research