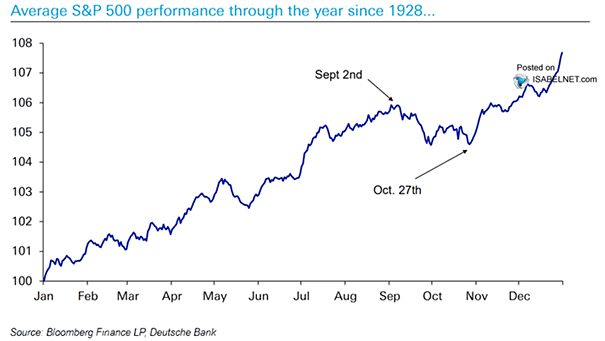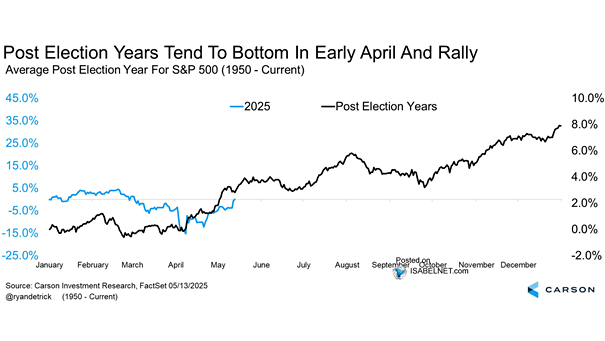
Average Post-Election Year for S&P 500
Average Post-Election Year for S&P 500 In post-election years, U.S. stocks often hit bottom by late October — before ripping higher into year-end, a seasonal gift Wall Street can’t resist. Image: Carson Investment Research