U.S. Federal Debt
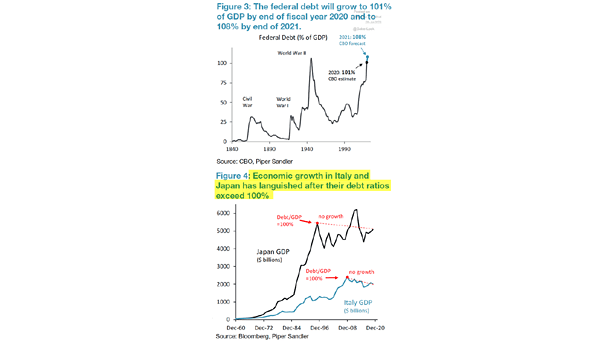
U.S. Federal Debt A potential warning sign for the U.S. economy, as economic growth in Japan and Italy came to a halt after their debt-to-GDP ratios exceeded 100%. Image: Piper Sandler
U.S. Federal Debt A potential warning sign for the U.S. economy, as economic growth in Japan and Italy came to a halt after their debt-to-GDP ratios exceeded 100%. Image: Piper Sandler
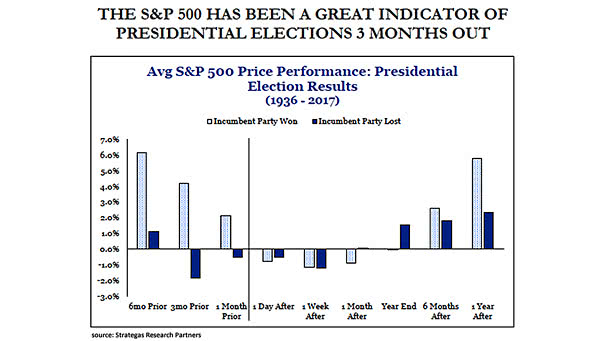
Average S&P 500 Price Performance – U.S. Presidential Election Results The S&P 500 has been a great indicator in the three months prior to the U.S. presidential election. Image: Strategas Research Partners
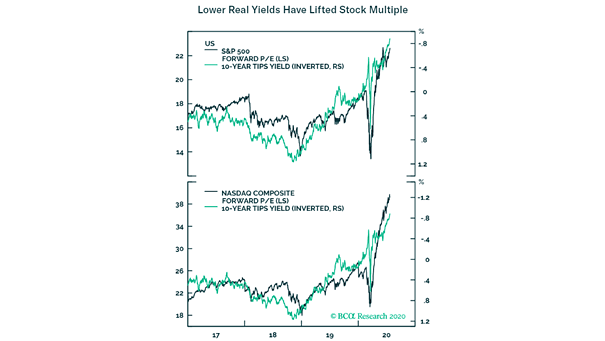
Valuation – S&P 500 and Nasdaq Composite Forward P/E vs. U.S. 10-Year TIPS Yield This chart suggests the good correlation between stock multiple and U.S. real yields (inverted). Image: BCA Research
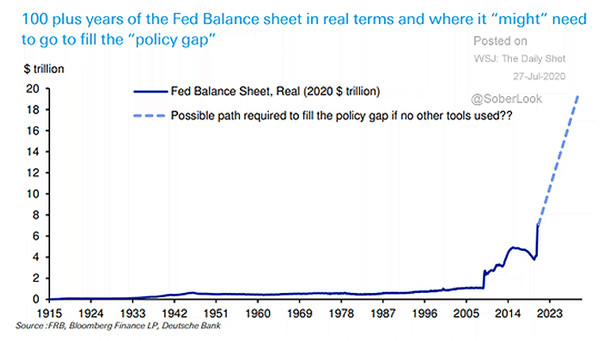
Fed Balance Sheet Forecast To infinity and beyond? The Fed balance sheet could grow at a sustained pace to fill the “policy gap”. Image: Deutsche Bank
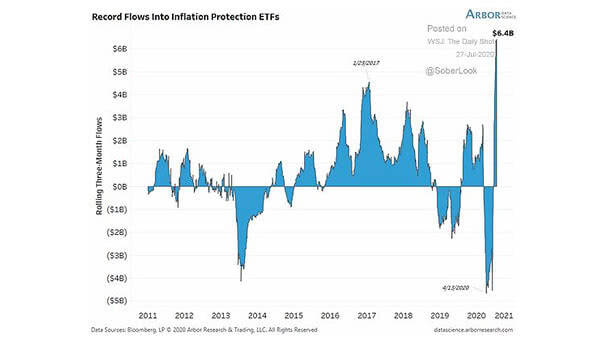
Flows into Inflation Protection ETFs Inflation protection ETFs see record inflows as investors predict inflation return. Image: Arbor Research & Trading LLC
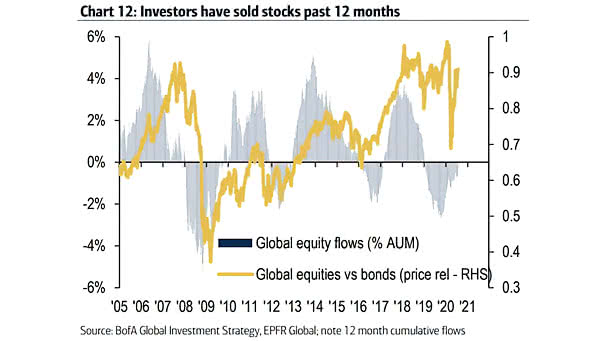
Global Equity Flows vs. Global Equities vs. Bonds Over the past 12 months, global equities suffer record outflows since the Global Financial Crisis. Image: BofA Global Investment Strategy
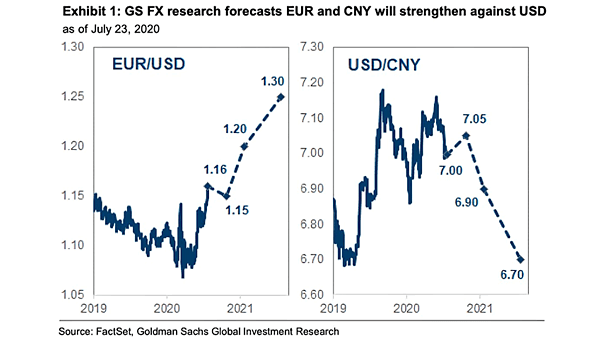
Euro to U.S. Dollar (EUR/USD) and U.S. Dollar to China Yuan (USD/CNY) According to Goldman Sachs, the U.S. dollar remains overvalued despite the recent selloff, and offers poor fundamentals. Image: Goldman Sachs Global Investment Research
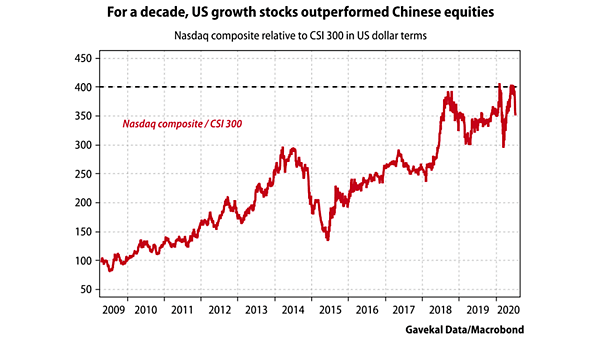
Nasdaq Composite Relative to CSI 300 Will U.S. growth stocks continue to outperform Chinese equities? Image: Gavekal, Macrobond
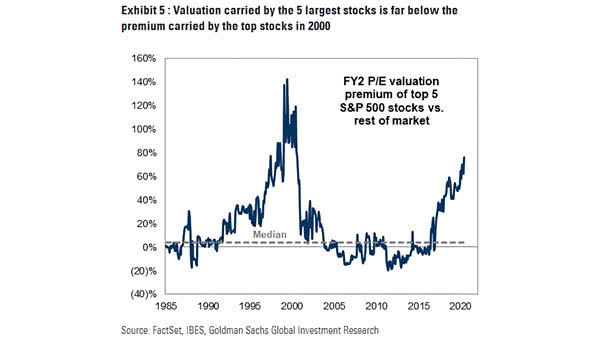
FY2 P/E Valuation Premium of Top Five S&P 500 Stocks vs. Rest of Market The valuation of the five largest stocks relative to the rest of the market is not as extreme as it was during the dotcom bubble. Image: Goldman Sachs Global Investment Research
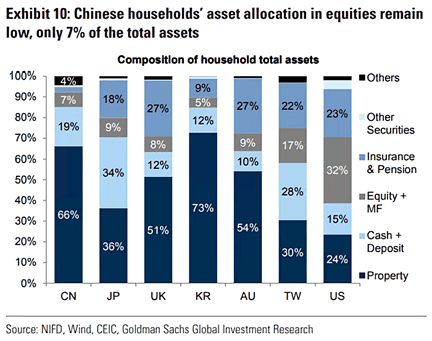
Composition of Household Total Assets Chinese households are under invested in equities, with only 7% of total assets compared to 32% for U.S. households. Image: Goldman Sachs Global Investment Research
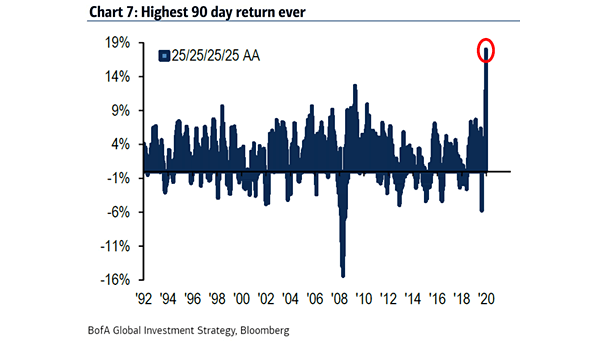
All Weather Portfolio (Stocks, Bonds, Cash and Gold) The All Weather Portfolio of 25/25/25/25 in stocks, bonds, cash and gold is up 18% over the past 90 days, the highest return ever. Image: BofA Global Investment Strategy