S&P 500 Companies and Profit Guidance
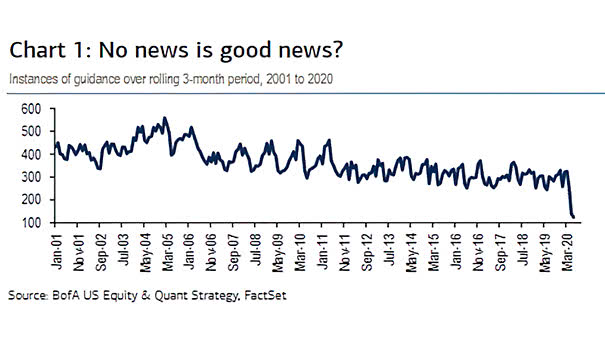
S&P 500 Companies and Profit Guidance Over the last three months, 80% of S&P 500 companies failed to provide guidance. That’s a record going back to 2001. Image: BofA US Equity & Quant Strategy
S&P 500 Companies and Profit Guidance Over the last three months, 80% of S&P 500 companies failed to provide guidance. That’s a record going back to 2001. Image: BofA US Equity & Quant Strategy
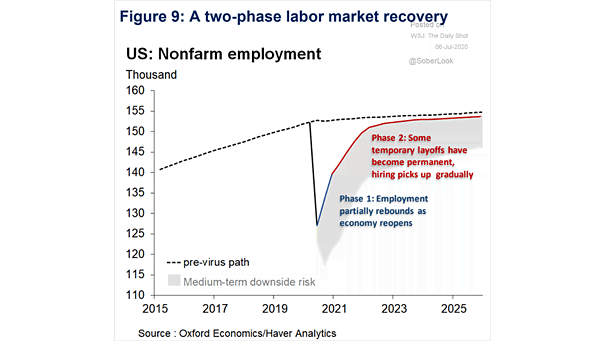
U.S. Nonfarm Employment This chart suggests a two-phase labor market recovery in the United States. Image: Oxford Economics
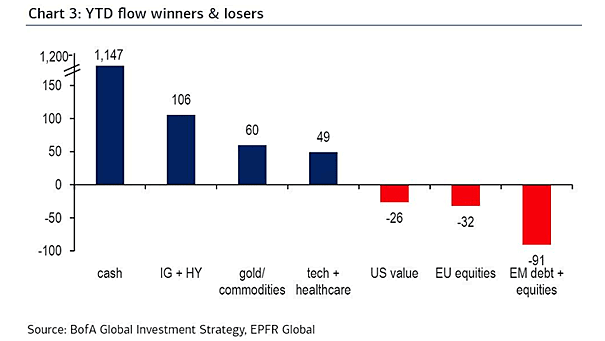
YTD Flow Winners and Losers Equities have seen billions in outflows year-to-date. Image: BofA Global Investment Strategy
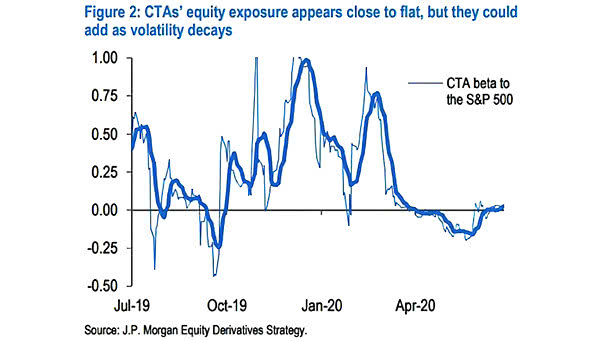
CTAs’ Equity Exposure (CTA Beta to the S&P 500) CTAs’ equity exposure is currently flat. Image: J.P. Morgan Equity Derivatives Strategy
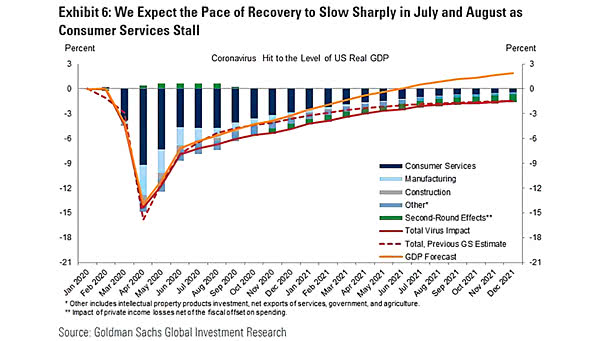
U.S. Real GDP Forecast Goldman Sachs revised its U.S. real GDP growth forecast. Image: Goldman Sachs Global Investment Research
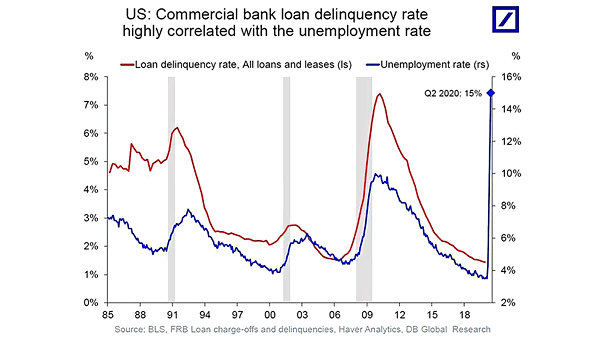
Commercial Bank Loan Delinquency Rate Chart suggesting that the commercial bank loan delinquency rate is expected to rise Image: Deutsche Bank Global Research
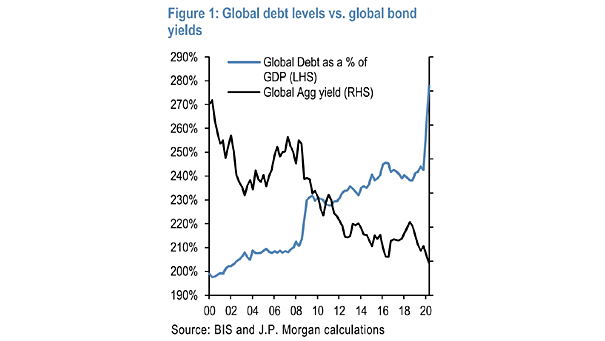
Global Debt Levels vs. Global Bond Yields Global debt is at all-time high, while global bond yields are at all-time low. Image: J.P. Morgan
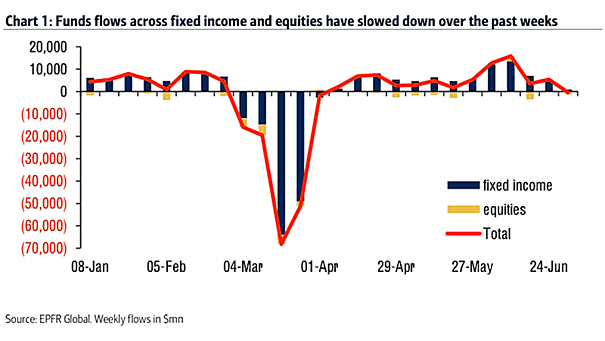
Funds Flows – Fixed Income and Equities Funds flows across fixed income and equities continued to slow for a third week. Image: BofA Global Research
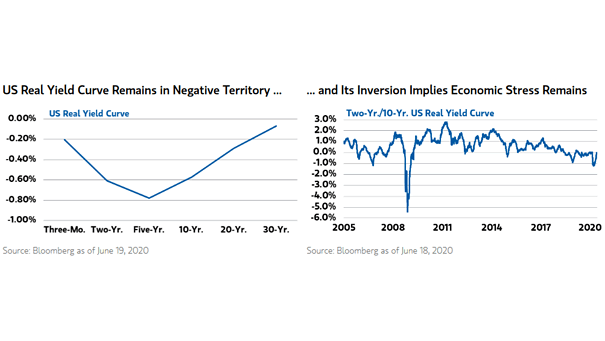
U.S. Real Yield Curve and 2-Year/30-Year U.S. Real Yield Curve Economic stress remains as the U.S. real yield curve remains in negative territory. Image: Morgan Stanley Research
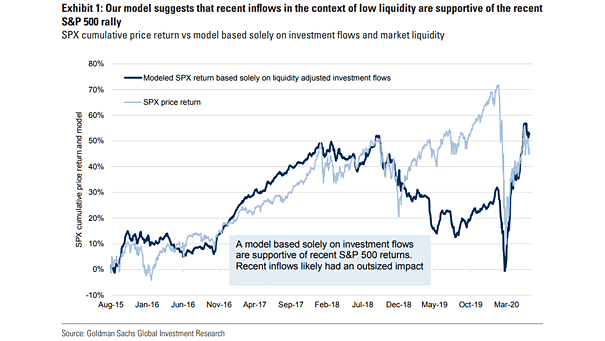
S&P 500 Cumulative Price Return vs. Model Based Solely on Investment Flows and Market Liquidity The analysis from Goldman Sachs suggests that the S&P 500 has underperformed liquidity-adjusted investment flows. Image: Goldman Sachs Global Investment Research
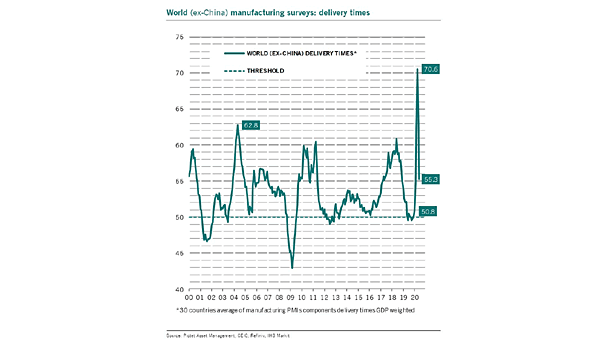
World (ex-China) Manufacturing Surveys – Delivery Times The coronavirus pandemic disrupted global supply chains. This chart suggests that delivery times have now shortened significantly. Image: Pictet Asset Management