G4 Central Bank Balance Sheet, Flow
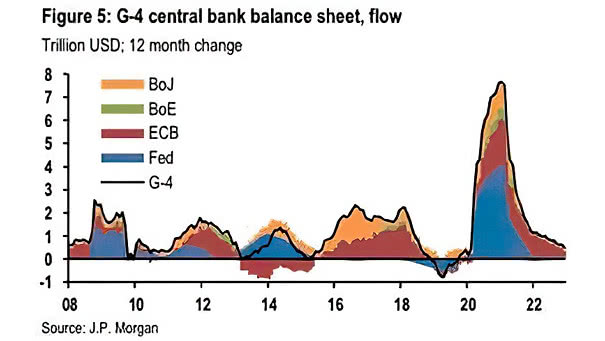
G4 Central Bank Balance Sheet, Flow The combined G4 central bank balance sheet (Fed, ECB, BoJ, BoE) is expected to expand further. Image: J.P. Morgan
G4 Central Bank Balance Sheet, Flow The combined G4 central bank balance sheet (Fed, ECB, BoJ, BoE) is expected to expand further. Image: J.P. Morgan
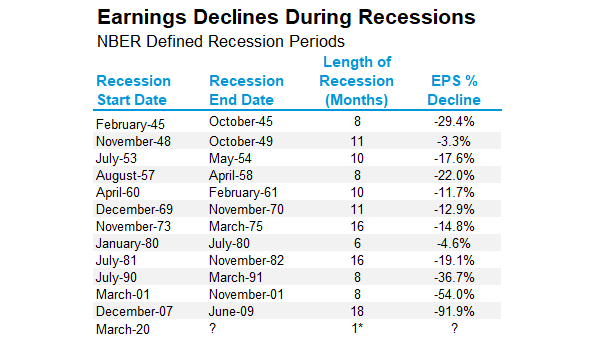
Earnings Declines During Recessions Historically, earnings tend to decline by a median of 18% during an U.S. recession. Image: LPL Research
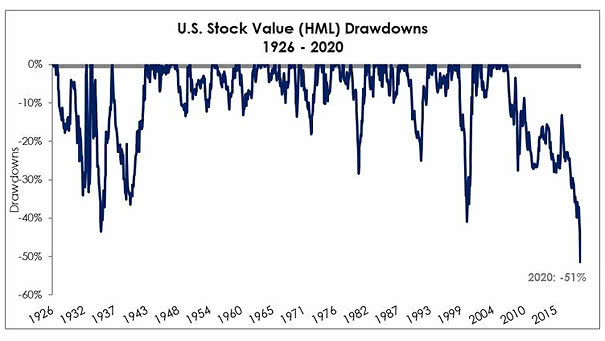
U.S. Stock Value (HML) Drawdowns Is traditional value investing dead? Value factor is down -51% from the peak. Image: Professor Kenneth R. French
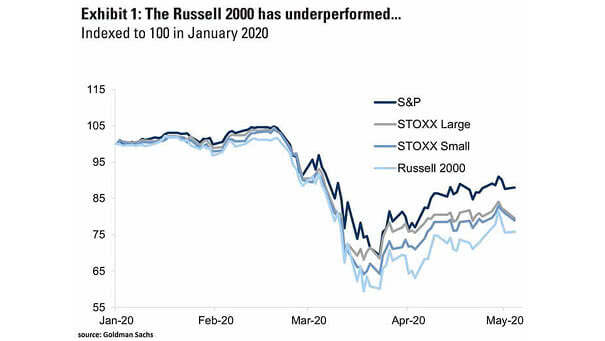
S&P 500 vs. Russell 2000 The Russell 2000 has underperformed recently. Tech accounts for 25% of the S&P 500 vs. 15% of the Russell 2000. Image: Goldman Sachs Global Investment Research
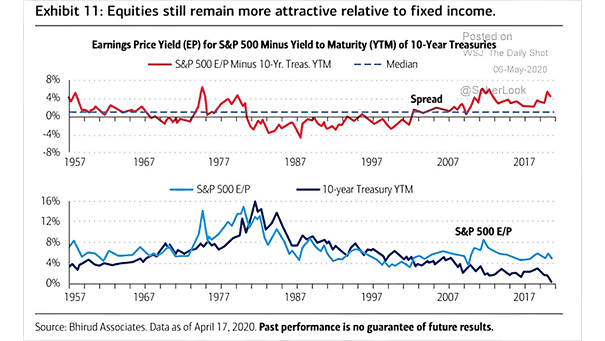
Earnings Price Yield for S&P 500 Minus Maturity of 10-Year Treasuries This chart suggests that equities are more attractive relative to fixed income. But the equity risk does not disappear because the spread (earnings yield minus Treasury yield) is positive. Image: Bhirud Associates
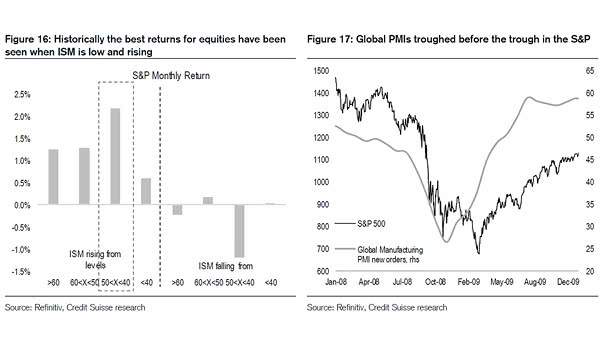
ISM PMI and S&P 500 Monthly Return Historically, the best returns for the S&P 500 have been seen when ISM is low and rising. Image: Credit Suisse Research
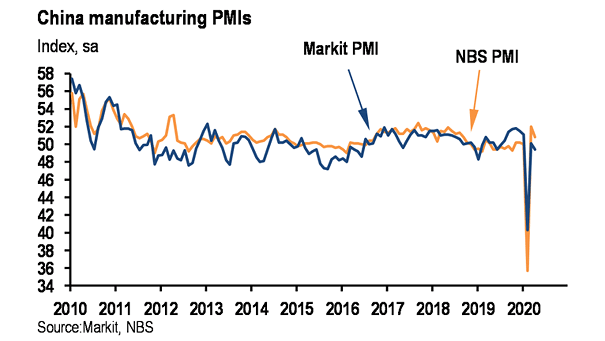
China Manufacturing PMI China Manufacturing PMIs suggest ongoing recovery, after a deep contraction in the first quarter. Image: J.P. Morgan
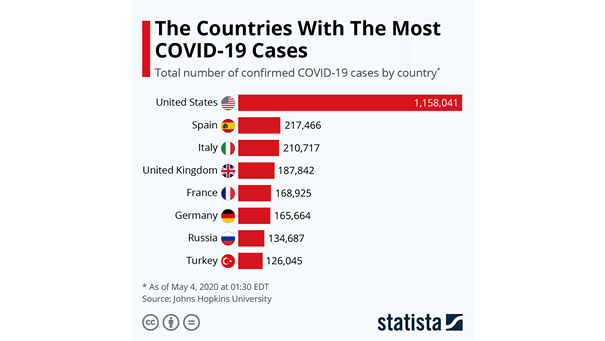
Total Number of Confirmed Coronavirus Cases by Country The United States has a total of more than one million cases of COVID-19. Image: Statista
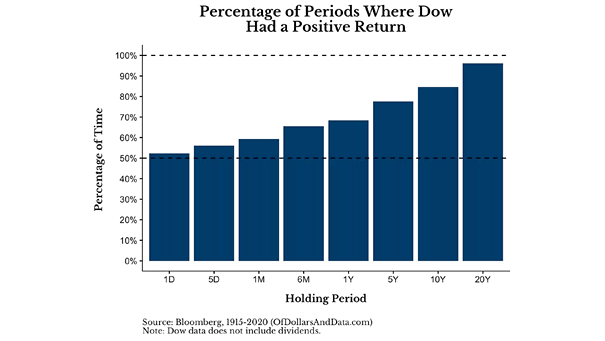
Percentage of Periods Where the Dow Jones Had a Positive Return The probability of a positive return converges towards 100% over a long period of time. Image: Of Dollars And Data
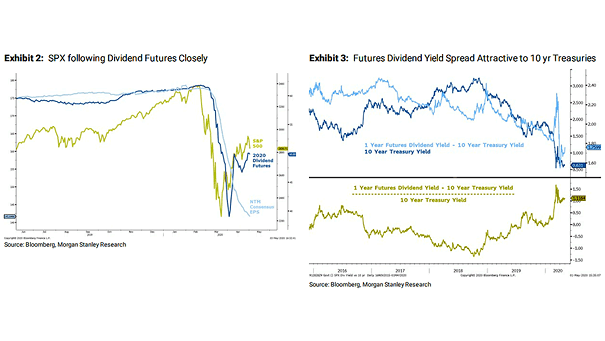
S&P 500 and Dividend Futures This chart suggests that the S&P 500 does appear to be trading off dividend forecasts more than earnings. Image: Morgan Stanley Research
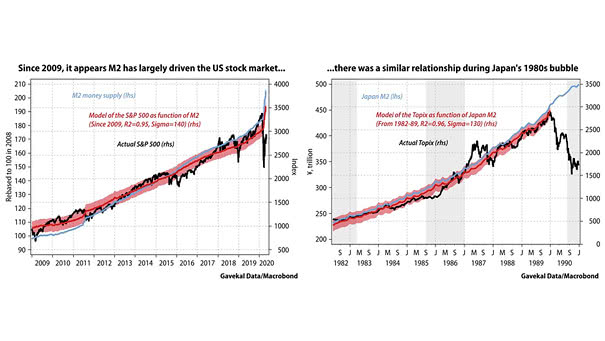
M2 Money Supply and S&P 500 vs. Japan M2 and Topix M2 is rising significantly in the U.S., as during the Japanese bubble market of the 1980s. Image: Gavekal, Macrobond