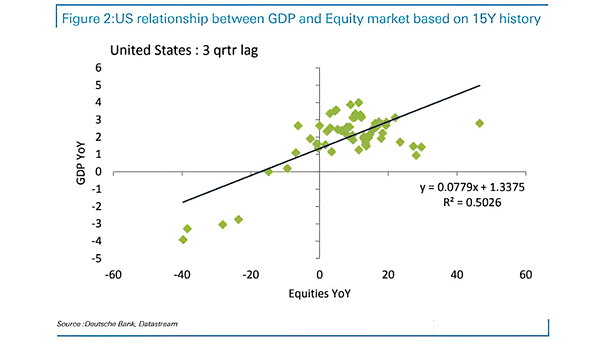
U.S. Correlation Between GDP and Equity Market
U.S. Correlation Between GDP and Equity Market This chart shows the correlation between U.S. GDP and U.S. equity market (R² = 0.50). U.S. equity prices suggest U.S. GDP growth of 0.7% YoY in Q3 2020. Image: Deutsche Bank