Asset Bubbles – Bitcoin, Equities and Bonds
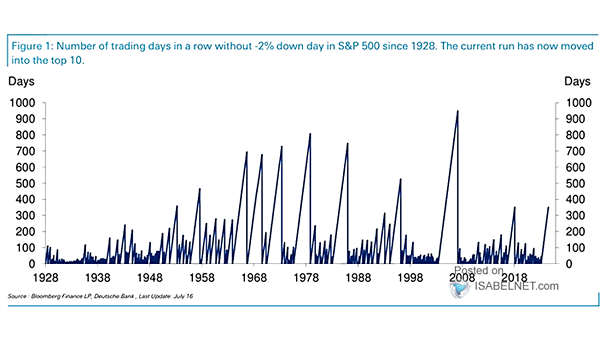
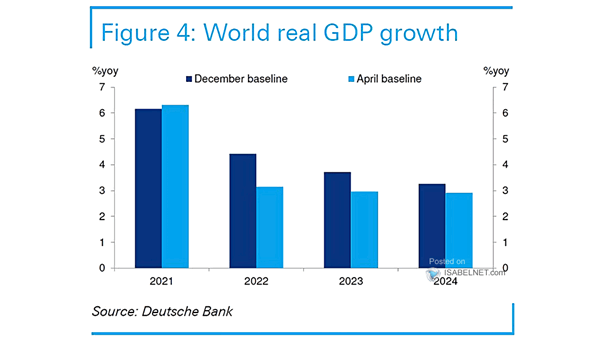
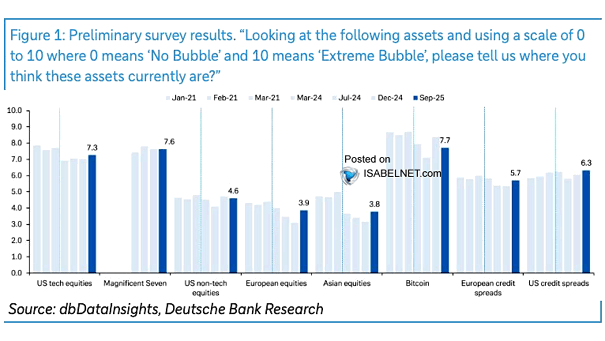
Asset Bubbles – Bitcoin, Equities and Bonds While caution is always warranted and some assets look frothy, extreme market bubbles are not apparent right now—though pockets of overvaluation do remain. Image: Deutsche Bank Research