U.S. Nonstore Retail Sales
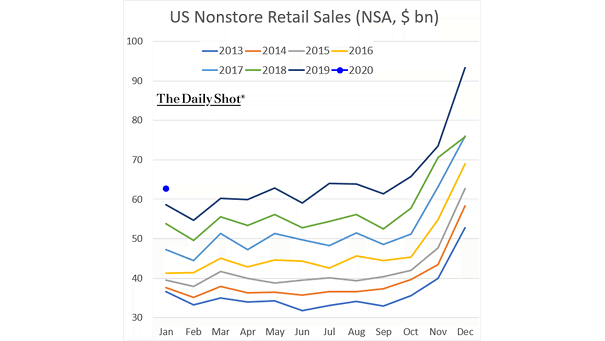
U.S. Nonstore Retail Sales This chart puts into perspective U.S. nonstore retail sales, which are a proxy measure for ecommerce performance. Image: The Daily Shot
U.S. Nonstore Retail Sales This chart puts into perspective U.S. nonstore retail sales, which are a proxy measure for ecommerce performance. Image: The Daily Shot
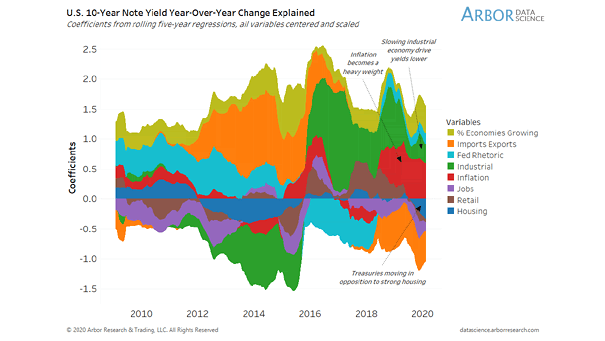
U.S. 10-Year Treasury Note Yield Year-Over-Year Change Explained Chart suggesting that the slowing industrial economy and inflation explain U.S. 10-year Treasury note yield. Image: Arbor Research & Trading LLC
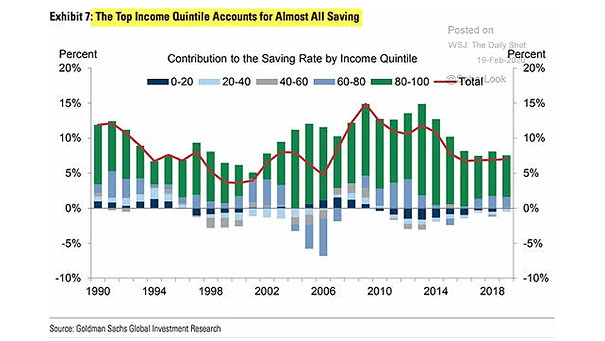
Inequality – Contribution to the Saving Rate by Income Quintile in the U.S. The top 20% of households account for almost all the savings in the United States. Image: Goldman Sachs Global Investment Research
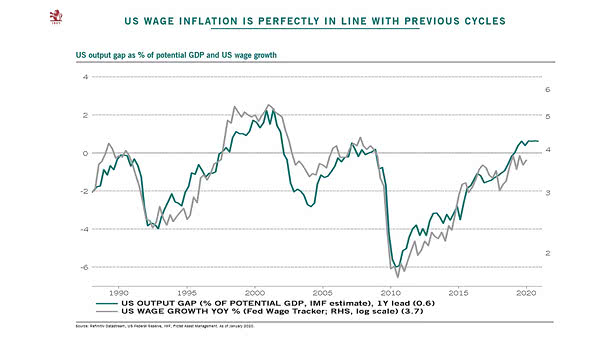
U.S. Output Gap as % of Potential GDP and U.S. Wage Growth (Leading Indicator) Chart suggesting that US output gap as % of potential GDP tends to lead US wage growth by one year. Image: Pictet Asset Management
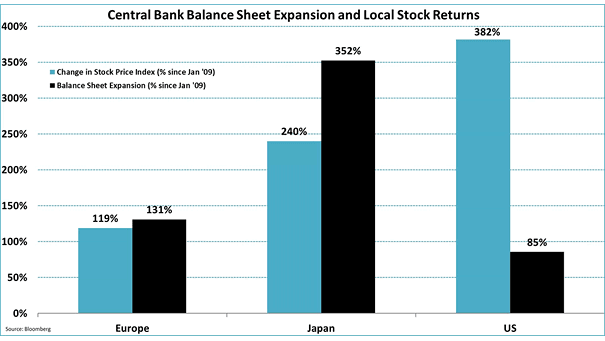
Central Bank Balance Sheet Expansion and Local Stock Returns Central bank balance sheet expansion matters, but not as much as investors think. Image: Jeroen Blokland
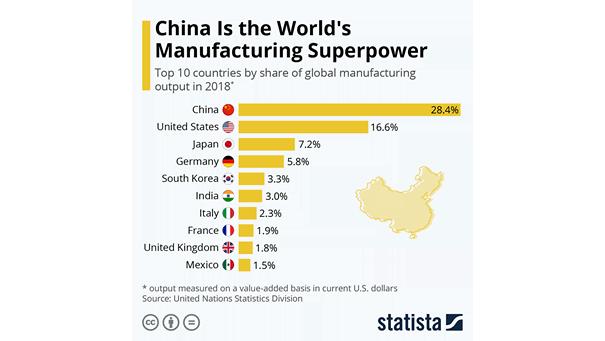
Top 10 Countries by Share of Global Manufacturing Output China manufacturing accounted for 28.4% of the country’s total economic output. Could the ripple effects of the coronavirus affect China’s ranking? Image: Statista
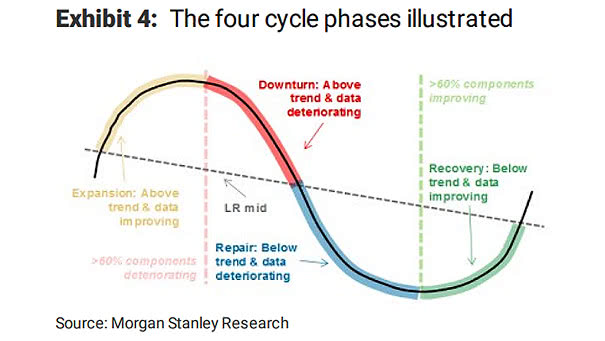
The Four Business Cycle Phases This chart explains the four cycle phases; expansion, downturn, repair, and recovery. Image: Morgan Stanley Research
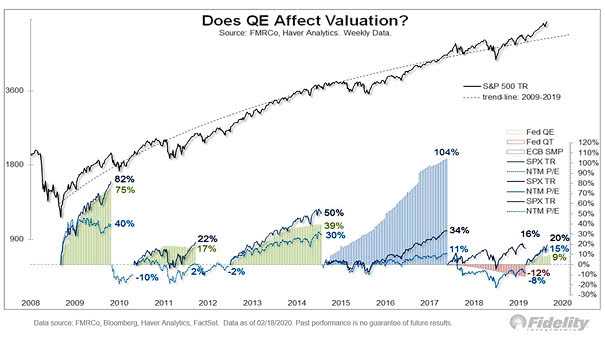
Does Quantitative Easing Affect Valuation? More fundamentally, low interest rates, high margins, low taxes, buybacks & free cash flow drive stocks higher. Image: Fidelity Investments
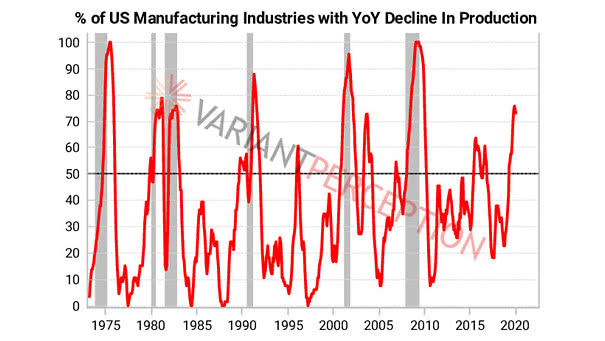
% of U.S. Manufacturing Industries with YoY Decline in Production A recession hasn’t arrived yet in the U.S., with almost 75% of manufacturing industries with year-over-year decline in production. Image: Variant Perception
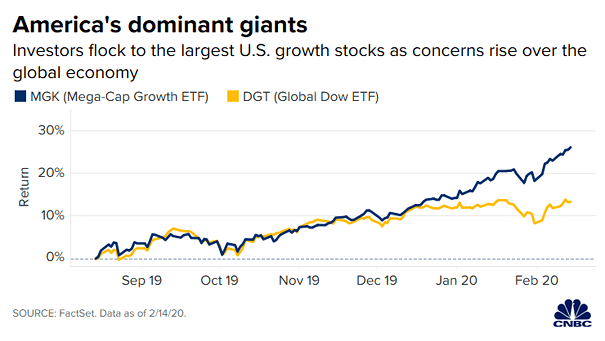
U.S. Growth Stocks – Mega-Cap Growth ETF vs. Global Dow ETF This chart suggests a warning sign of market ‘euphoria’, as the P/E of the Vanguard Mega-Cap Growth ETF is now 30. Image: CNBC
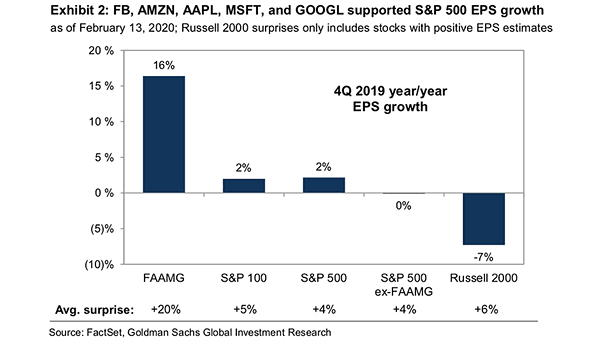
Facebook, Amazon, Apple, Microsoft and Google and S&P 500 EPS Growth FAAMG supported S&P 500 EPS growth. Image: Goldman Sachs Global Investment Research