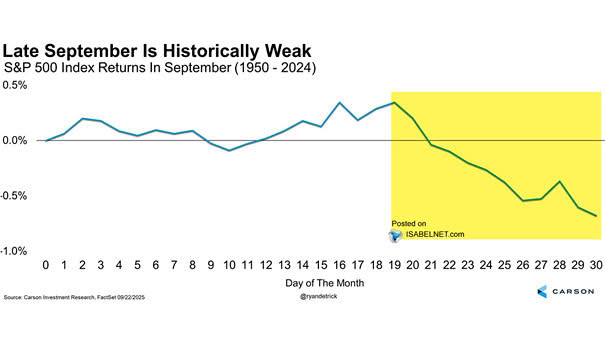
S&P 500 Index Returns in September
S&P 500 Index Returns in September Late September is often a banana-peel moment for U.S. stocks, when markets have a tendency to slip. Image: Carson Investment Research
S&P 500 Index Returns in September Late September is often a banana-peel moment for U.S. stocks, when markets have a tendency to slip. Image: Carson Investment Research
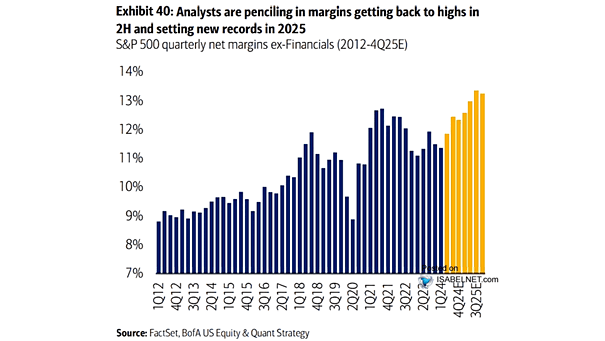
S&P 500 Trailing 4-Quarter Net Profit Margin (Ex. Financials) Over the past 35 years, the S&P 500’s profit margin has climbed from 5% to 12% and has held at high levels in recent years, with forecasts pointing to continued growth in 2026 and 2027. Image: Goldman Sachs Global Investment Research
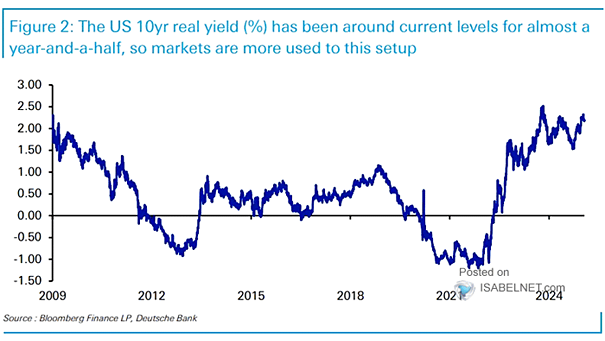
U.S. 10-Year Real Yield (TIPS) The recent decline in U.S. 10-year real yields points to growing investor caution, with labor market softening fueling bets on more Fed easing ahead. Image: Deutsche Bank
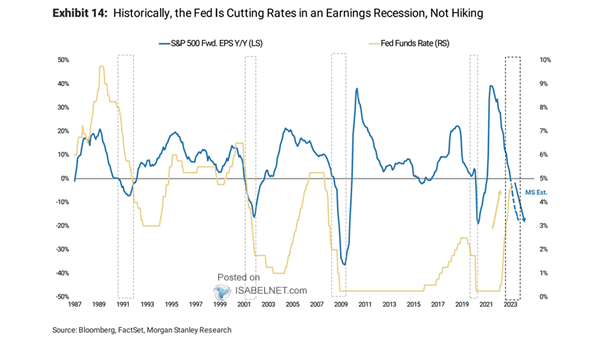
Fed Funds Rate and S&P 500 TTM EPS Growth Strong EPS growth, combined with Fed rate cuts, often fuels equities by reducing funding costs, boosting investment and sustaining earnings momentum—the classic drivers of bull markets. Image: TS Lombard
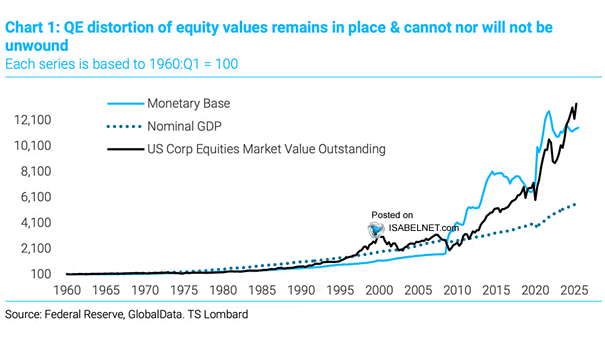
U.S. Corporate Equities Market Value Outstanding vs. Monetary Base vs. Nominal GDP Quantitative easing expands the monetary base, alongside a rising federal deficit, a combination that usually boosts financial asset prices but delivers mixed and modest impacts on overall economic growth. Image: TS Lombard
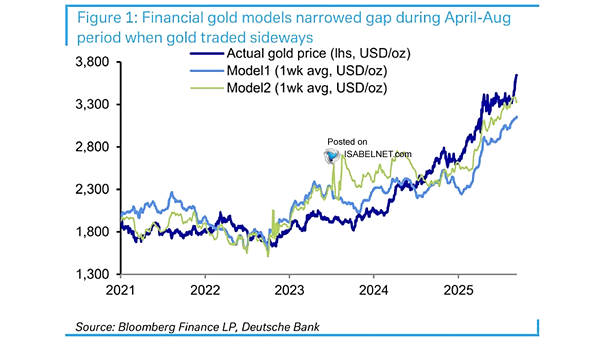
Financial Gold Models Deutsche Bank has raised its gold price forecast to an average of $4,000 per ounce for 2026, driven by strong central bank buying, a weakening U.S. dollar, expected Fed rate cuts, and ongoing global uncertainties. Image: Deutsche Bank
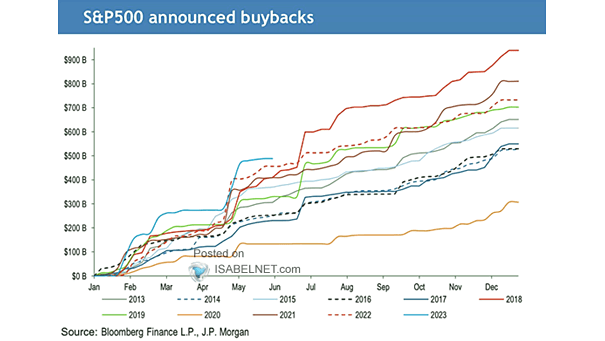
Announced Share Repurchases (U.S. Buybacks) The surge in S&P 500 buybacks this year, backed by solid earnings, liquidity, and targeted capital allocation, marks a pivotal year for shareholder value and market gains. Image: J.P. Morgan Equity and Quantitative Strategy
Gold Annual Returns Up 40% this year, gold is enjoying its strongest rally since 1979’s 133% surge. But so far, the rise has stirred far less hysteria than in earlier eras, leaving room for further gains in the near to medium term. Image: Carson Investment Research
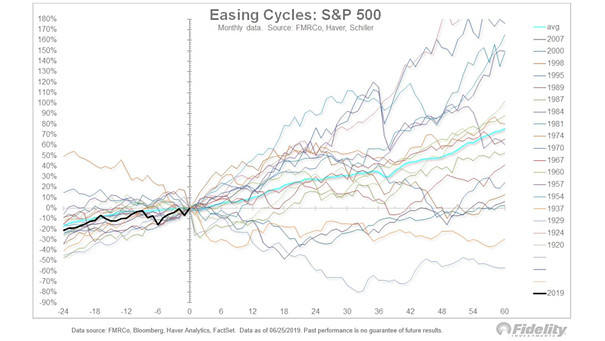
S&P 500 Index Around First Cut Following Easing Cycle Pauses of Six Months or More Historically, when the Fed resumes rate cuts after holding steady for at least six months, U.S. stocks often post strong gains over the following year—especially when the cuts reflect economic normalization rather than recession. Image: Ned Davis Research
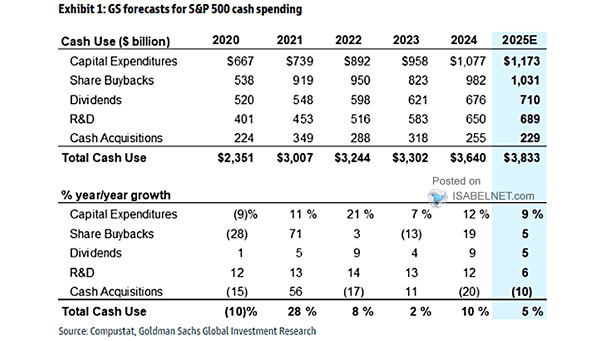
S&P 500 Cash Spending Relative to Cash Flows Many S&P 500 companies devote substantial cash flow to stock buybacks, a practice that benefits shareholders in the short term but sparks concerns about favoring short-term gains over long-term growth. Image: Goldman Sachs Global Investment Research
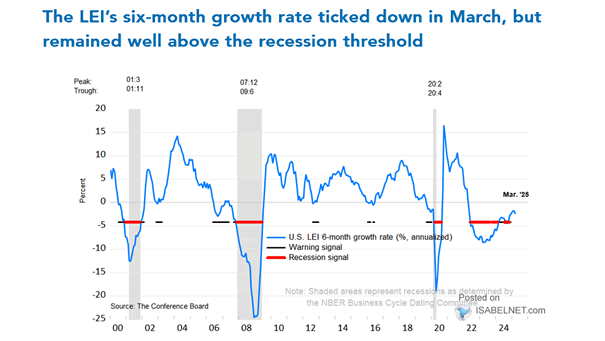
The Conference Board Leading Economic Index (LEI) for the U.S. A 0.5% decline in the U.S. Leading Economic Index (LEI) in August 2025 indicates an ongoing slowdown in U.S. economic activity. Image: The Conference Board