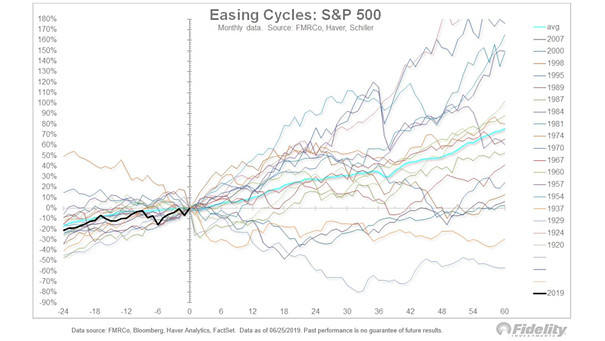
S&P 500 Index Around First Cut Following Easing Cycle Pauses of Six Months or More
S&P 500 Index Around First Cut Following Easing Cycle Pauses of Six Months or More Historically, when the Fed resumes rate cuts after holding steady for at least six months, U.S. stocks often post strong gains over the following year—especially when the cuts reflect economic normalization rather than recession. Image: Ned Davis Research