Fed Funds Rate Scenario Analysis
Fed Funds Rate Scenario Analysis In its baseline scenario, Goldman Sachs forecasts that the Fed will cut interest rates from 4.3% to 3.1% by the end of 2026. Image: Goldman Sachs Global Investment Research
Fed Funds Rate Scenario Analysis In its baseline scenario, Goldman Sachs forecasts that the Fed will cut interest rates from 4.3% to 3.1% by the end of 2026. Image: Goldman Sachs Global Investment Research
S&P 500 Returns After Fed Interest Rate Cuts Resume When the Fed delivered just one or two rate cuts after pausing—seen in four different cycles—the U.S. economy was typically strong, with cyclical sectors such as financials and industrials outperforming the broader market. Image: Bloomberg
S&P 500 Performance After 30% Rallies in Five Months A rally of over 30% in just five months is an exceptionally rare occurrence for the S&P 500, having happened only five times since 1950. In every case, the index was higher one year later, with average gains exceeding 18%. Image: Carson Investment Research
U.S. Sectors With Rising EPS Rising EPS across almost all major U.S. sectors is a significant driver of equity market strength and investor confidence, as it signals strong corporate profitability and growth potential. Image: TS Lombard
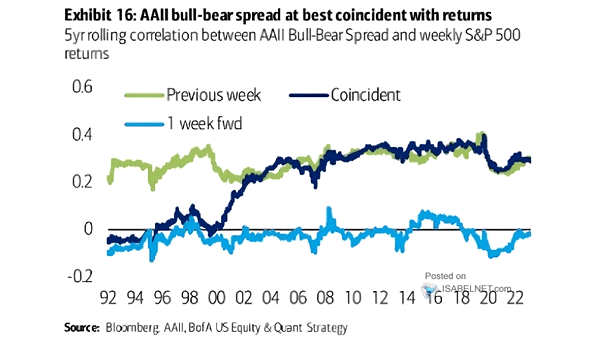
S&P 500 Ratio to Its 200-DMA and AAII Investor Sentiment Bull Minus Bear Spread Historically, very low investor sentiment has not only signaled caution but also suggested further upside in U.S. equities, offering opportunities for contrarian investors. Image: Deutsche Bank Asset Allocation
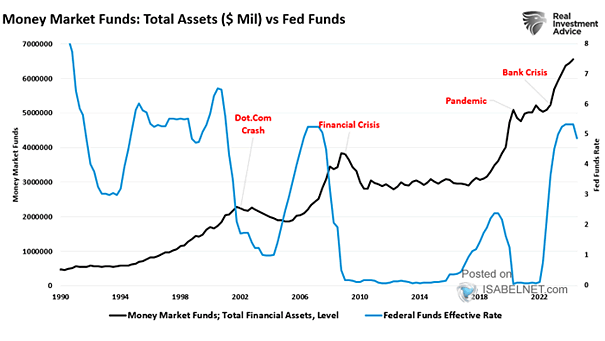
U.S. Money Market Fund Assets vs. Federal Funds Effective Rate U.S. money market funds typically experience asset inflows during rate hikes but see outflows approximately 12 months after the Fed initiates rate cuts. Image: Real Investment Advice
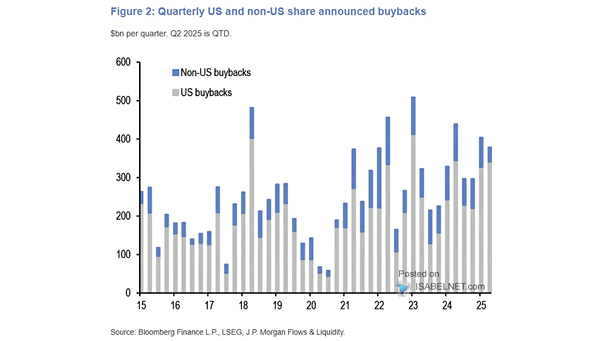
U.S. and Non-U.S. Share Announced Buybacks by Year JPMorgan strategists expect further strong growth in buyback volumes, noting that the first eight months of 2025 have already matched last year’s total, providing ongoing support for equity markets. Image: J.P. Morgan
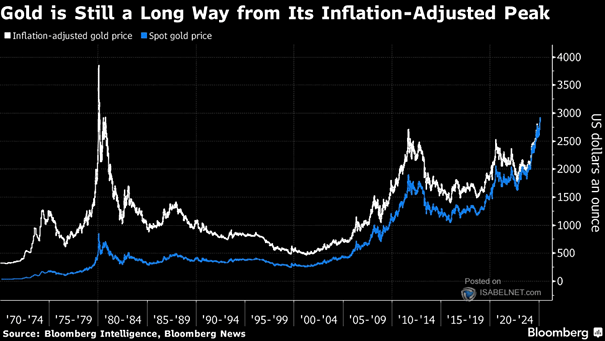
Gold Adjusted for Inflation Gold has just surpassed its inflation-adjusted record high from 1980, marking an important milestone as both a hedge against inflation and a gauge of currency weakness. Image: Bloomberg
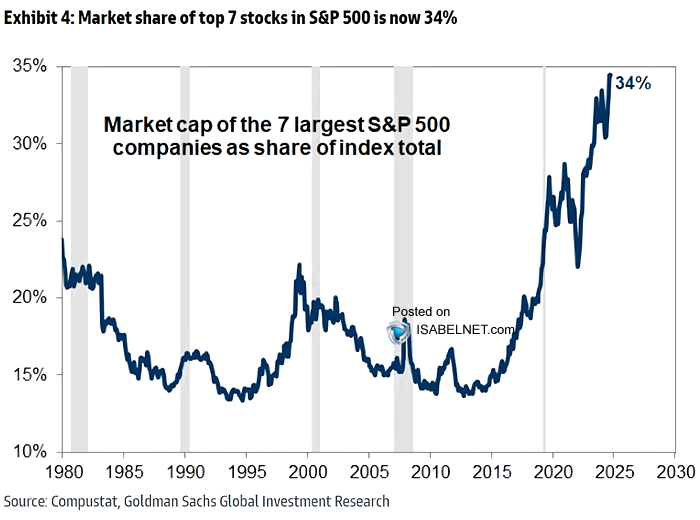
Seven Largest Companies as Share of S&P 500 Total Market Capitalization The seven largest stocks in the S&P 500 make up 34% of the index’s total market capitalization. Although such a high concentration doesn’t guarantee market declines, it has the potential to increase volatility. Image: Goldman Sachs Global Investment Research
S&P 500 Buyback Yield While S&P 500 share buybacks remain significant, their impact on reducing share counts and boosting returns to shareholders is diminishing compared to past years. Image: Goldman Sachs Global Investment Research
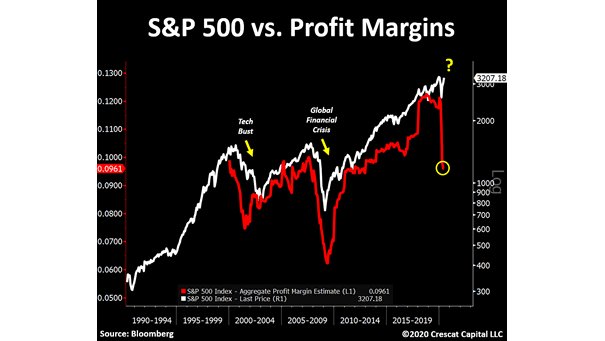
S&P 500 – U.S. Broad Market Net Forward Profit Margin Elevated profit margins in the U.S. broad market, which continue to show forward-looking expansion, point to underlying economic resilience and do not align with the start of a severe, systemic labor market downturn. Image: TS Lombard