S&P 500 Price to Book Value vs. Future Returns
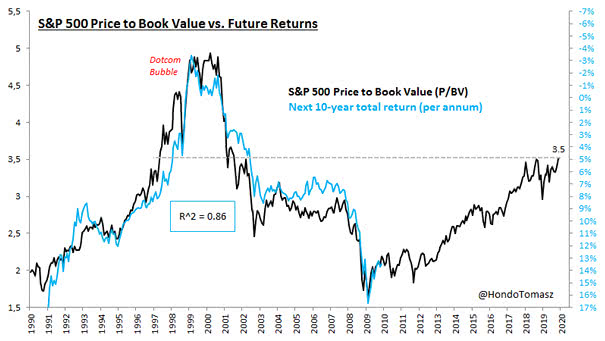
S&P 500 Price to Book Value vs. Future Returns The current S&P 500 price to book value suggests that equity market returns will be low over the next 10 years (R² = 0.86). Image: Tomasz Hońdo
S&P 500 Price to Book Value vs. Future Returns The current S&P 500 price to book value suggests that equity market returns will be low over the next 10 years (R² = 0.86). Image: Tomasz Hońdo
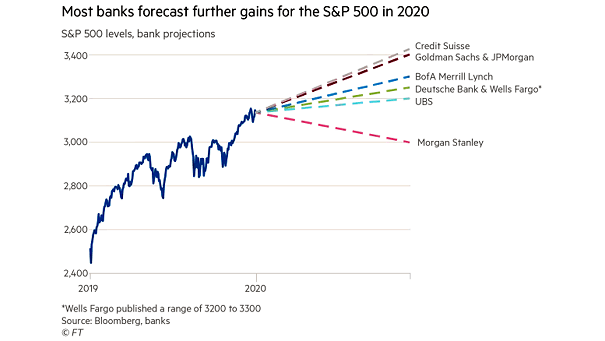
S&P 500 Levels, Bank Projections Morgan Stanley is a bear, but Wall Street expects gains for the S&P 500 in 2020 Image: Financial Times
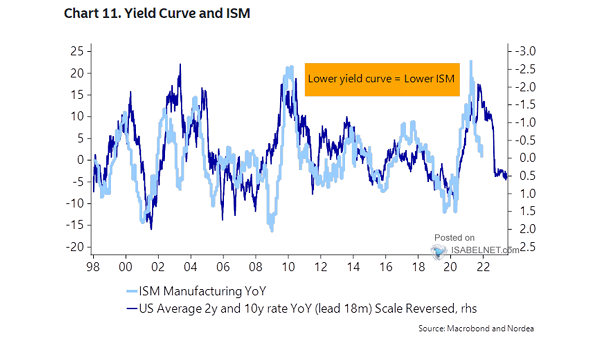
Yield Curve 10Y-2Y and U.S. ISM Manufacturing Index Chart suggesting that the U.S. 2+10Y bond yield YoY (inverted) tends to lead the U.S. ISM Manufacturing Index (YoY) by 18 months. U.S. PMI could bounce back in 2020. Image: Nordea and Macrobond
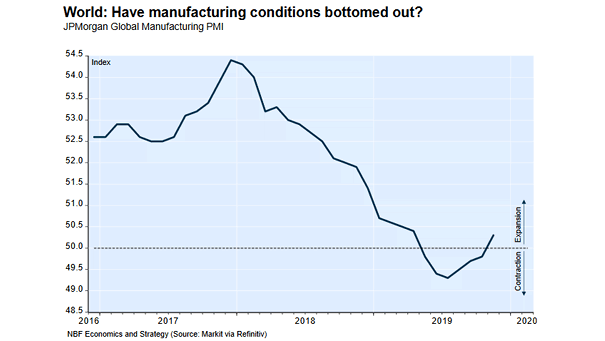
JPMorgan Global Manufacturing PMI The JPMorgan Global Manufacturing PMI rises to a seven-month high of 50.3, after having been in contraction territory. NBF Economics and Strategy
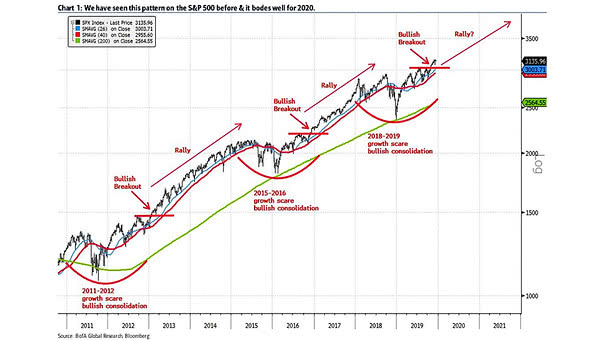
The 2020 S&P 500 Upside Level According to BofAML, history suggests a bullish setup for the S&P 500 in 2020, and a S&P 500 target of 3300-3600 in late 2020. Image: BofA Merrill Lynch Global Research
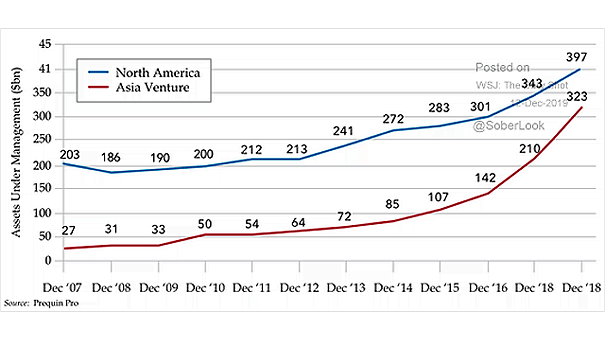
Venture Capital Assets Under Management The center of venture capital gravity is shifting. Asia could overtake the United States. Image: Quill Intelligence, LLC
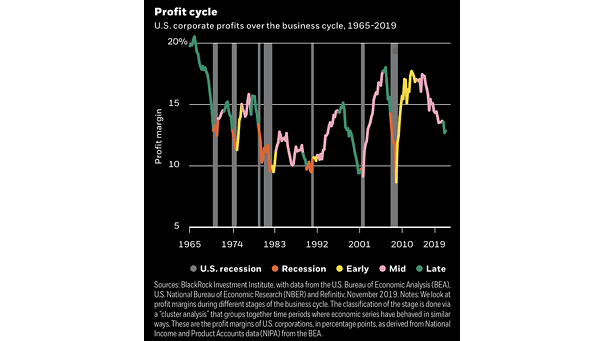
U.S. Corporate Profits over the Business Cycle U.S. corporate profits are at risk in the late stage of the expansion. mage: BlackRock Investment Institute
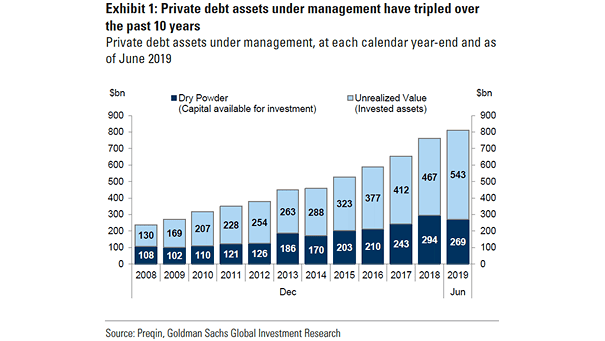
Private Debt Assets Under Management Private debt assets under management have tripled over the past decade to $812 billion. Investors are looking to increase yield in a world of low interest rates. Image: Goldman Sachs Global Investment Research
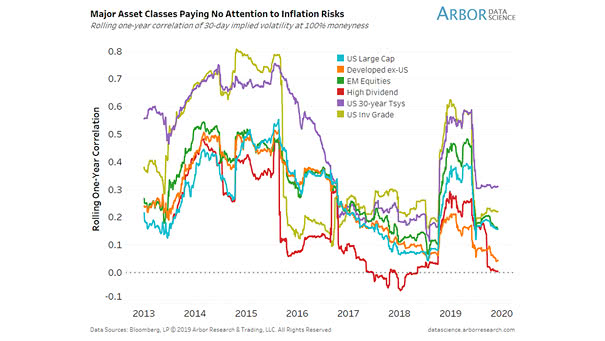
Asset Classes and Inflation Risks Chart suggesting that major asset classes do not take inflation risks into account. Image: Arbor Research & Trading LLC
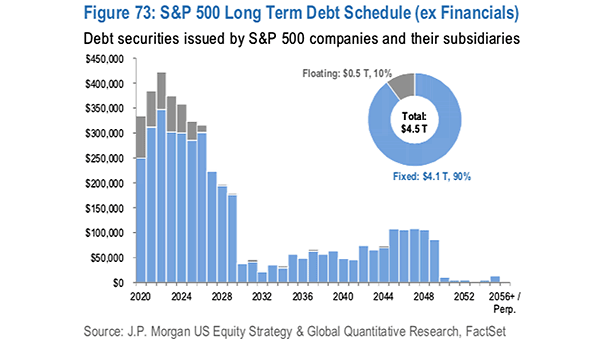
Debt Securities Issued by S&P 500 Companies Should investors be concerned about the corporate debt maturity wall? This chart shows the long term S&P 500 debt maturity schedule. Image: J.P. Morgan US Equity Strategy & Global Quantitative Research
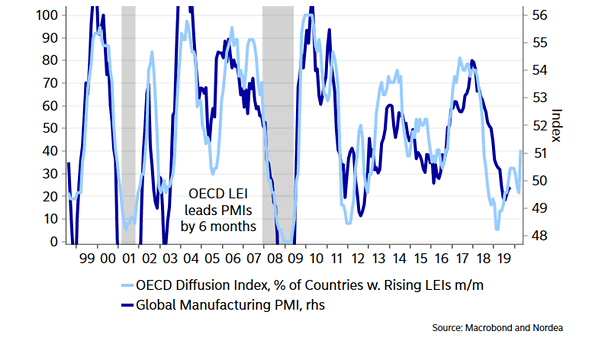
OECD LEI Tends to Lead Global Manufacturing PMI by 6 Months Chart suggesting a pick-up in the global manufacturing PMI. Image: Nordea and Macrobond