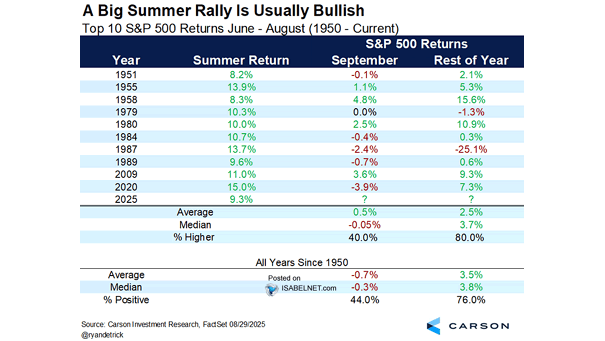
Top 10 S&P 500 Returns June – August
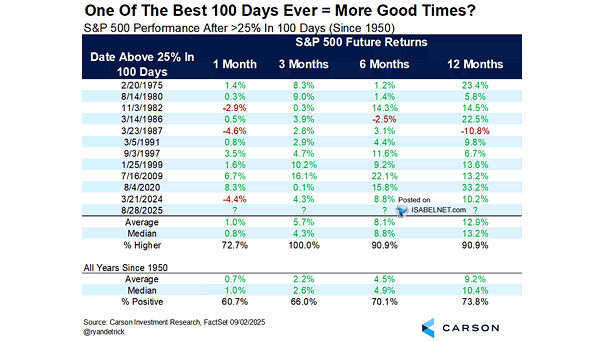
Top 10 S&P 500 Returns June – August A strong summer rally, such as the one in 2025, typically signals bullish sentiment and often leads to further gains in the S&P 500 for the remainder of the year, based on historical trends observed in the ten best summer rallies. Image: Carson Investment Research