U.S. Business Cycle: Output Gap vs. Core PCE Inflation

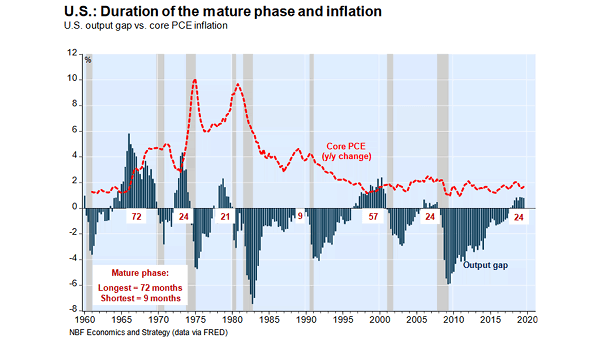
U.S. Business Cycle: Output Gap vs. Core PCE Inflation The mature phase of the U.S. business cycle began 24 months ago. The mature phase lasted 72 months in the late 1960s and 57 months in the late 1990s. Image: NBF Economics and Strategy
U.S. Business Cycle: Actual vs. Potential U.S. Real GDP

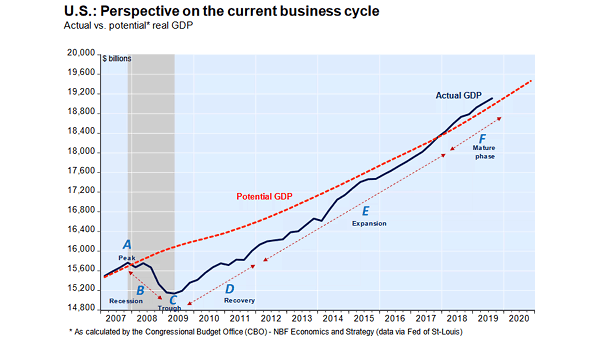
U.S. Business Cycle: Actual vs. Potential U.S. Real GDP The mature phase of the U.S. business cycle began 2 years ago. If inflation remains stable and the Fed avoids restrictive monetary policy, then the risk of recession is reduced. Image: NBF Economics and Strategy

U.S. Recession Chances

U.S. Recession Chances The recession probability model developed by Bloomberg economists now shows 26% chance of recession within 12 months. Image: Bloomberg

Value Stocks vs. Low Volatility Stocks

Value Stocks vs. Low Volatility Stocks Chart showing the large divergence between value stocks and low volatility stocks, like never before. Image: J.P. Morgan

Inequality – The Global Wealth Pyramid

Inequality – The Global Wealth Pyramid The level of wealth inequality is high in 2019: the richest 10% of adults own 82% of global wealth, while the bottom half of adults account for less than 1%. Image: Credit Suisse

S&P 500 Return A Year Later Off The Midterm Election Lows

S&P 500 Return A Year Later Off The Midterm Election Lows A year after the midterm lows, the S&P 500 is up 32% on average. History also shows that the S&P 500 has been higher 17 out of the last 17 times, since 1950. Image: Ryan Detrick, LPL Financial LLC