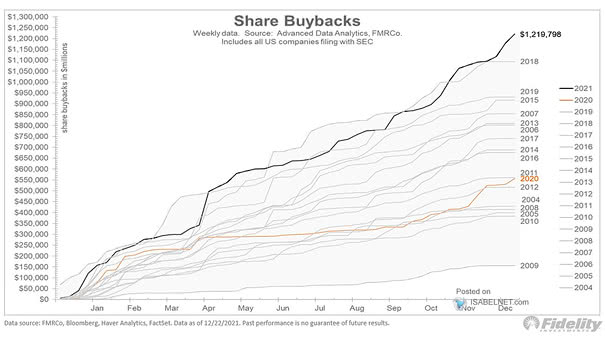
Announced Buyback Value
Announced Share Buybacks in the U.S. The ongoing pipeline of stock repurchase programs demonstrates strong confidence among executives and continues to underpin the U.S. stock market through 2025 and beyond. Image: Bloomberg
Announced Share Buybacks in the U.S. The ongoing pipeline of stock repurchase programs demonstrates strong confidence among executives and continues to underpin the U.S. stock market through 2025 and beyond. Image: Bloomberg
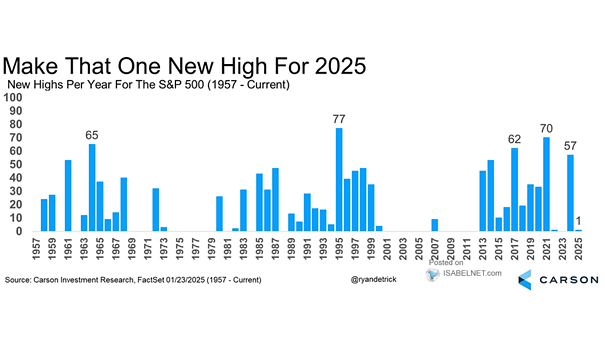
New S&P 500 Index All-Time Highs Per Year Yesterday, the S&P 500 hit its nineteenth record high of 2025, underscoring persistent market optimism. The index has gained 10.55% so far this year, driven by robust corporate earnings and steady economic data. Image: Carson Investment Research
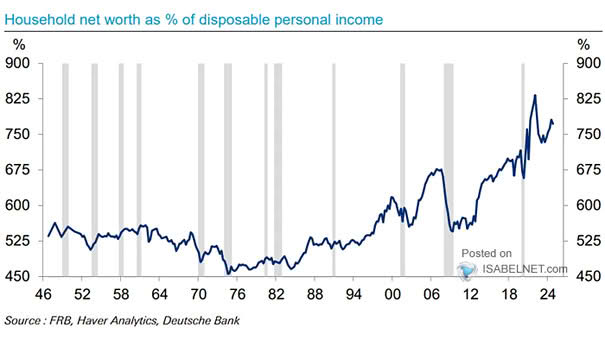
U.S. Household Net Worth as % of Disposal Personal Income While the U.S. household net worth has risen to historic levels due to assets like stocks and real estate, AI-driven financial gains mainly benefit the richest, increasing the wealth gap. Image: Deutsche Bank
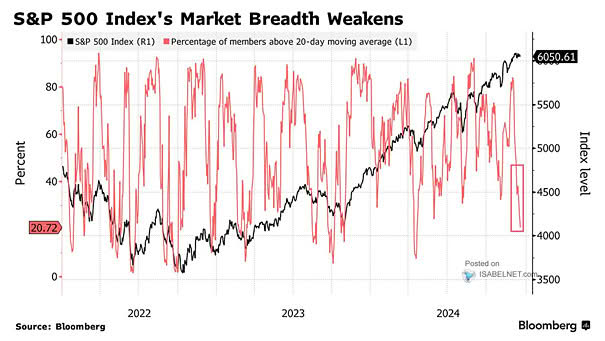
S&P 500 and 20-Day Moving Average Since April, after tariff-related lows, the S&P 500 has used the 20-day moving average as a floor during pullbacks, continuing its upward trend and sustaining a bullish outlook. Image: Fundstrat Global Advisors, LLC
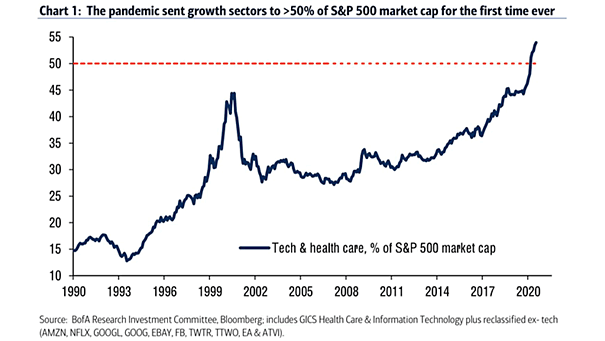
Health Care Sector Weight in the S&P 500 With a 9% weight in the S&P 500 and an earnings share of 10%, the health care sector represents an important, though not dominant, part of the index. Image: Goldman Sachs Global Investment Research
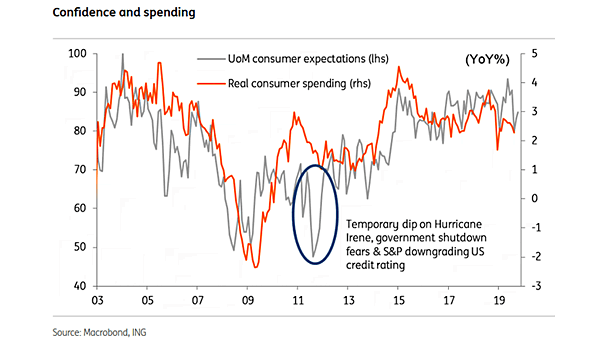
Real U.S. Consumer Spending During the first half of 2025, U.S. inflation-adjusted consumer spending contracted—the weakest pace seen in over 15 years—driven by cautious consumer behavior amid tariff concerns and economic uncertainties. Image: Deutsche Bank
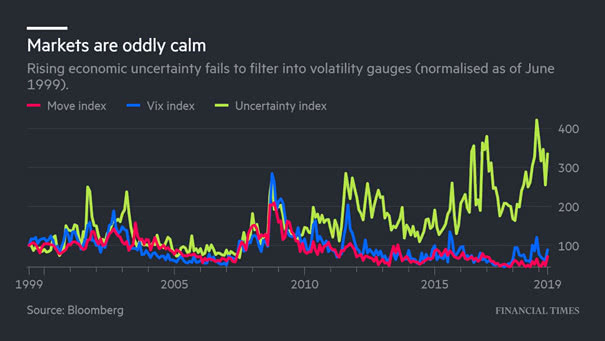
MOVE, VIX and FX Volatility The “Goldilocks summer” of market calm is essentially over, as mounting concerns about the U.S. economy awaken markets from their seasonal slumber. Image: Bloomberg
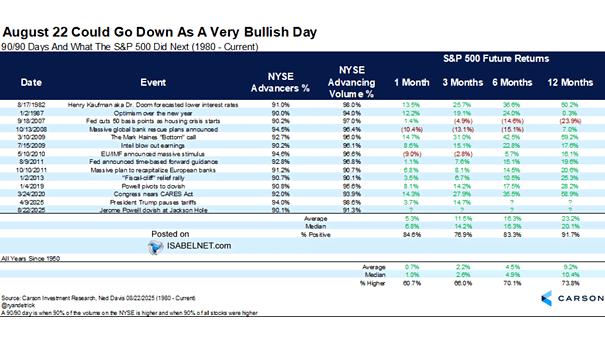
90/90 Days and What the S&P 500 Did Next The “90/90 days” back to 1980 often coincide with major policy events or changes, serving as drivers or inflection points for markets. Powell’s recent dovish pivot at Jackson Hole is a notable example. Image: Carson Investment Research
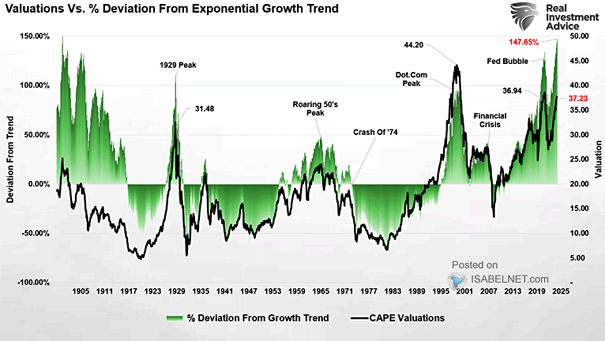
CAPE Valuations and Deviation from Exponential Growth Trend The current elevated Shiller CAPE ratio suggests that U.S. stock valuations are stretched relative to historical averages, a condition that has often preceded lower long-term investor returns. Image: Real Investment Advice
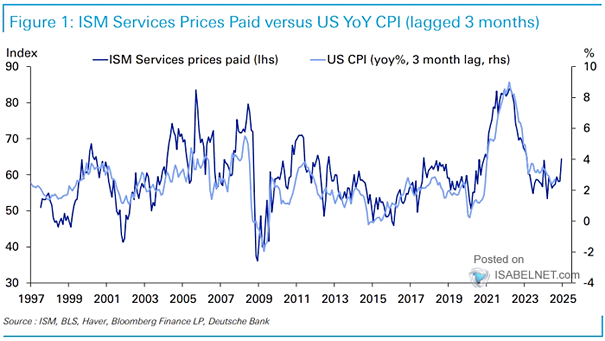
U.S. ISM Services Prices Paid Index vs. U.S. CPI Inflation (Leading Indicator) The U.S. ISM Services Prices Paid Index typically leads U.S. CPI inflation by three months, indicating that changes in the index can help predict future CPI trends. Image: Deutsche Bank
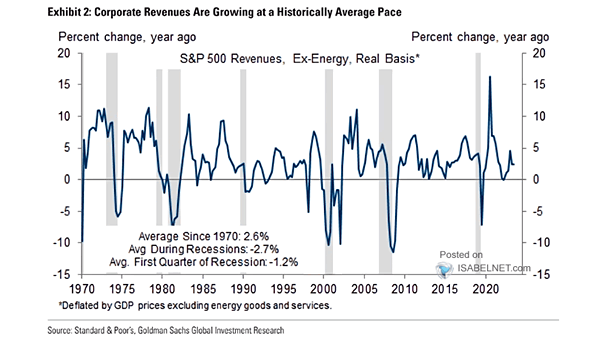
S&P 500 Revenues The reported 4.8% real revenue growth for the S&P 500 excluding energy in Q2 2025 is a strong indicator of economic strength, marking the highest growth since early 2022. Image: Goldman Sachs Global Investment Research