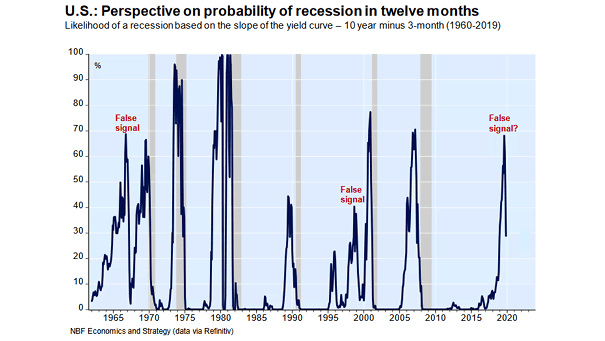
Probability of U.S. Recession in 12 Months Based on the Slope of the Yield Curve
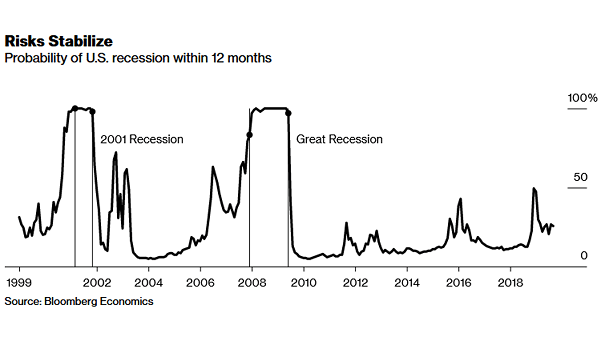
Probability of U.S. Recession in 12 Months Based on the Slope of the Yield Curve The yield curve slope suggests odds of a recession in the next 12 months at less than 30% in the U.S., and the continuation of economic expansion. Image: NBF Economics and Strategy