MSCI U.S. EPS vs. Trend
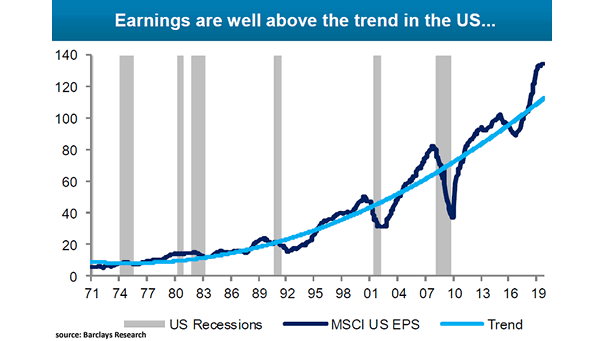
MSCI U.S. EPS vs. Trend History shows that earnings well above the trend in the U.S. precede earning plunges. Image: Barclays Research
MSCI U.S. EPS vs. Trend History shows that earnings well above the trend in the U.S. precede earning plunges. Image: Barclays Research
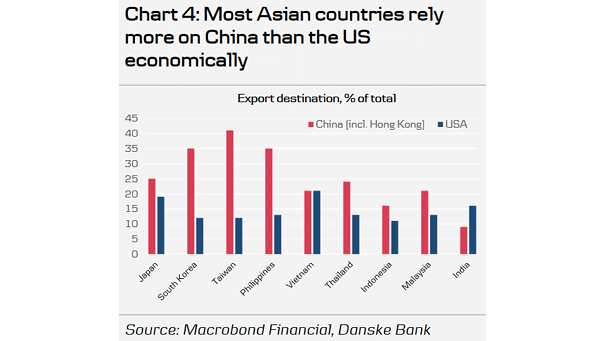
Export Destination: China vs. USA China is the largest export market of most Asian countries. Image: Danske Bank
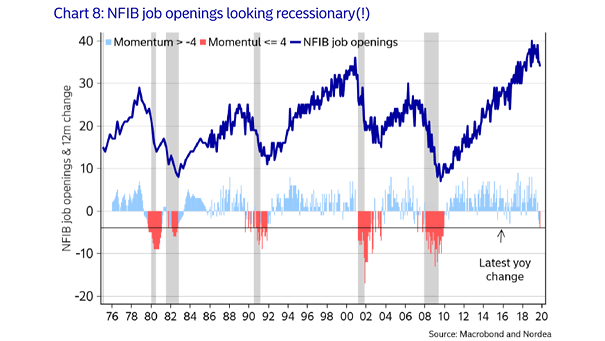
NFIB Job Openings and Recessions This chart shows that NFIB job openings, while high, could suggest a looming recession. Image: Nordea and Macrobond
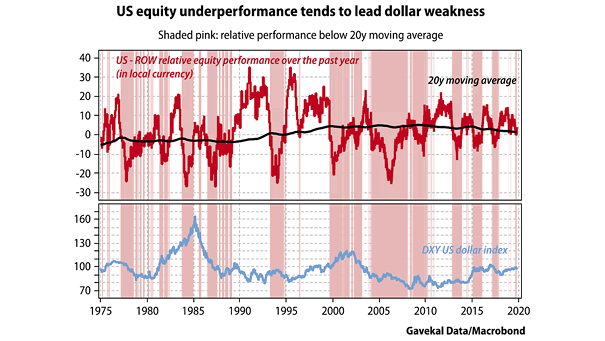
U.S. Equity Leads U.S. Dollar History suggests that U.S. equity underperformance leads U.S. dollar weakness. Image: Gavekal
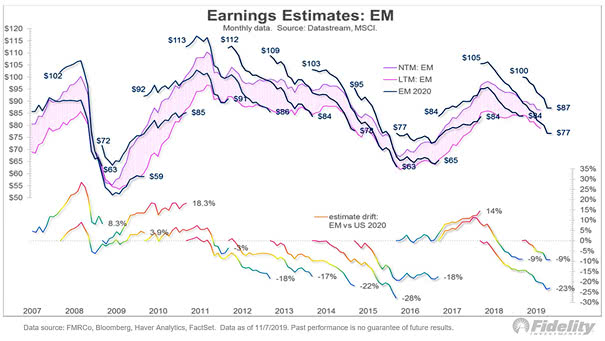
Emerging Markets Earnings Estimates Emerging markets earnings estimates are falling from $105 to $77 in 2019. Image: Fidelity Investments
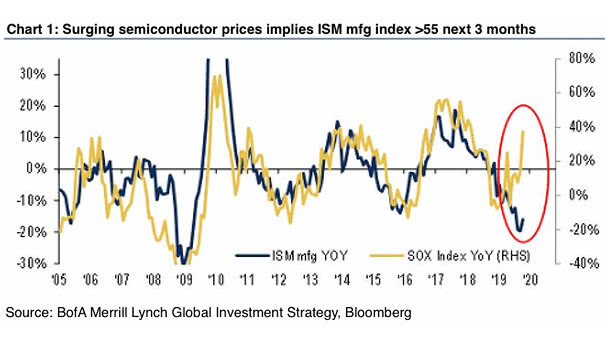
Semiconductor Prices and ISM Manufacturing Index Chart suggesting that the surge in semiconductor prices implies ISM Manufacturing Index above 55 in the next 3-months. Image: BofA Merrill Lynch Global Research
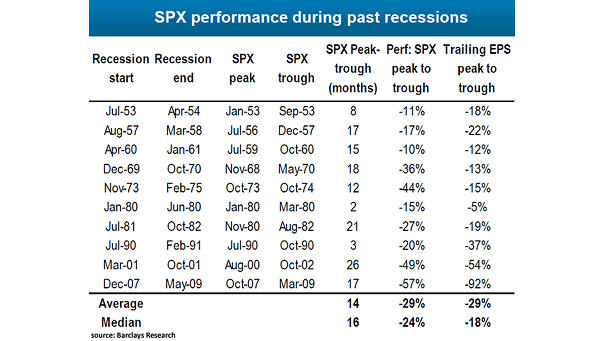
S&P 500 Performance During Past Recessions In recent history, the median S&P 500 performance during past recessions (peak to trough) is -24% Image: Barclays Research
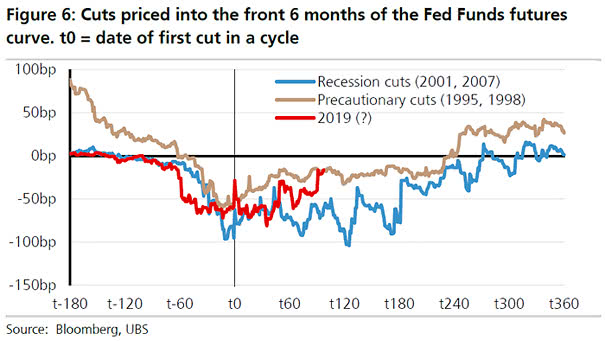
S&P 500 Index: Recession Rate Cuts vs. Precautionary Rate Cuts This chart shows what the U.S. market has done after first Fed cut in a business cycle. The current path follows precautionary rate cuts and does not suggest an imminent recession in the U.S.. Image: UBS
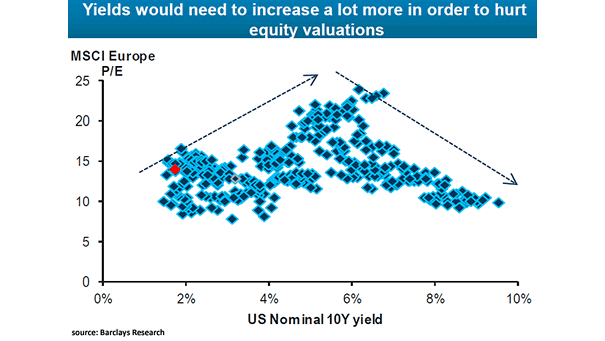
MSCI Europe P/E and U.S. Nominal 10-Year Yield Chart showing how nominal yields usually affect stock market valuation. Image: Barclays Research
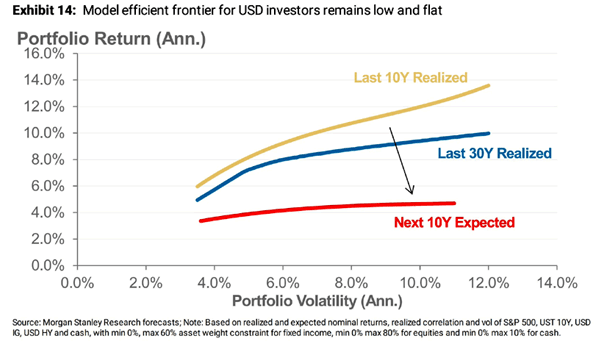
Outlook for Portfolio Returns Over the Next 10 Years Chart suggesting anemic returns over the next 10 years, due to low yields, low growth and low inflation expectations. Image: Morgan Stanley Research
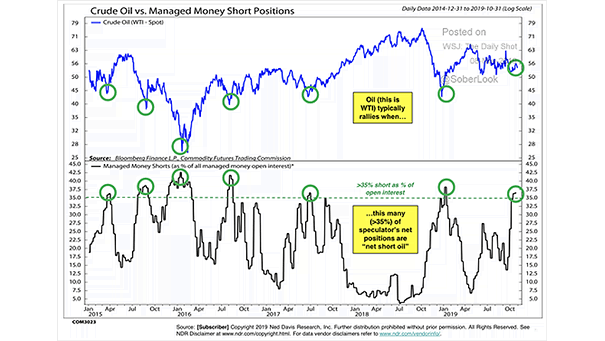
Crude Oil vs. Managed Money Short Positions Chart suggesting that oil could rise, when managed money short positions are so extreme. Image: Ned Davis Research, Stifel