ISM Non-Manufacturing Index, ISM Manufacturing Index and U.S. GDP
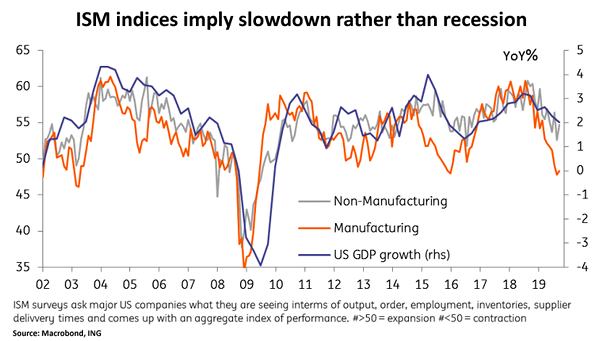
ISM Non-Manufacturing Index, ISM Manufacturing Index and U.S. GDP U.S. ISM indices suggest a slowdown in the US growth rate, but not an imminent recession. Image source: ING Economics
ISM Non-Manufacturing Index, ISM Manufacturing Index and U.S. GDP U.S. ISM indices suggest a slowdown in the US growth rate, but not an imminent recession. Image source: ING Economics
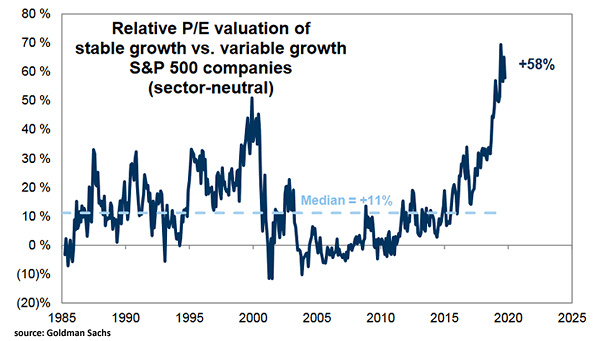
Relative P/E Valuation of Stable Growth vs. Variable Growth S&P 500 Companies Investors are paying a huge premium for stable growth S&P 500 companies vs. variable growth companies. Image: Goldman Sachs Global Investment Research
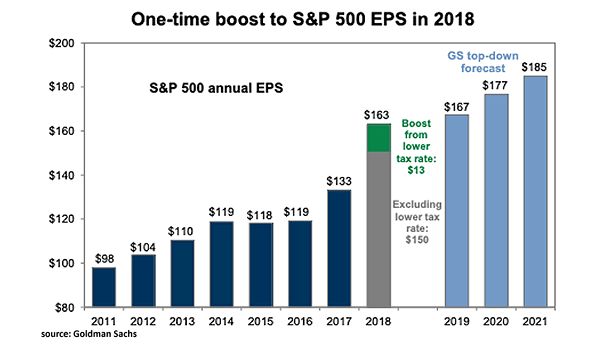
S&P 500 EPS Forecast Despite the earnings squeeze, Goldman Sachs is still positive on the S&P 500 earnings outlook. In 2020, U.S. and global growth should rebound modestly. Image: Goldman Sachs Global Investment Research
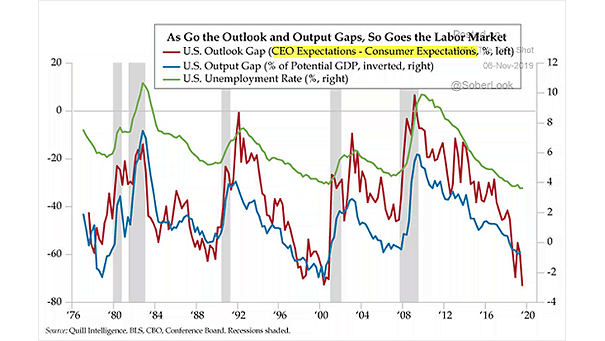
Business Cycle – U.S. Output Gap and Unemployment Rate Chart suggesting that the US economy has slipped into the late stage of the business cycle. Image: Quill Intelligence, LLC
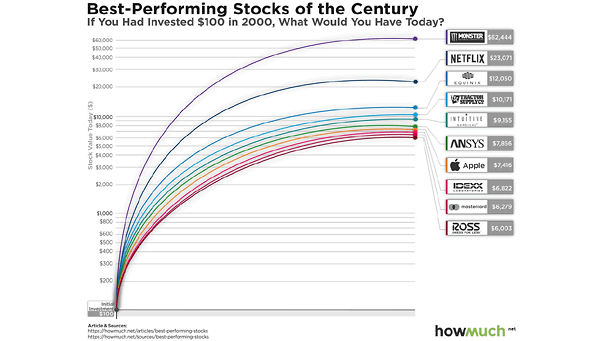
Best-Performing Stocks of the Century An initial investment of $100 in Monster’s stock would be worth $62,444 today. Image: howmuch.net
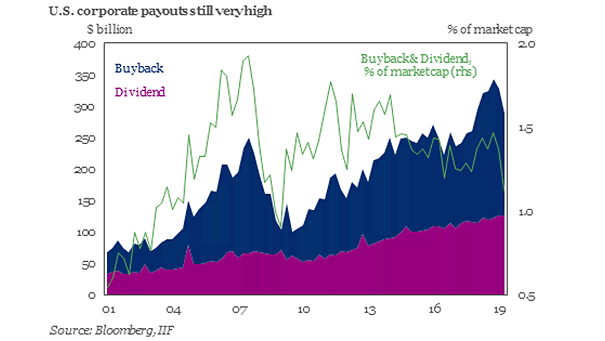
Buybacks and Dividends as Percentage of Market Capitalization Amid gloomy earnings, U.S. companies are increasingly using debt to fund buybacks and dividends. Image: Institute of International Finance
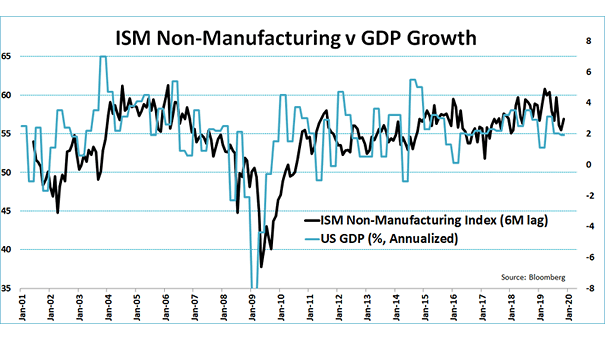
ISM Non-Manufacturing Index and U.S. GDP Growth Chart showing the good correlation between the ISM Non-Manufacturing Index (6M lag) and U.S. GDP growth. Image: Jeroen Blokland
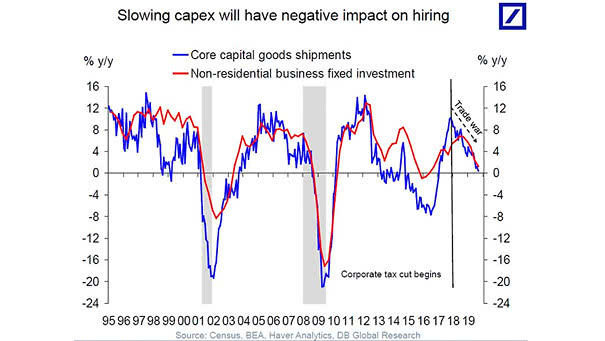
U.S. Core Capital Goods Shipment and Non-residential Business Fixed Investment (Capex) Is the “phase one” US-China trade deal enough to reverse the slowdown? Image: Deutsche Bank Global Research
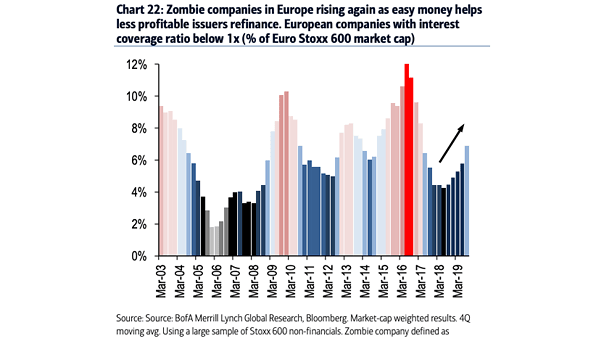
Zombie Companies in Europe After years of unprecedentedly easy monetary policy, zombie companies in Europe are back on the rise. Image: BofA Merrill Lynch Global Research
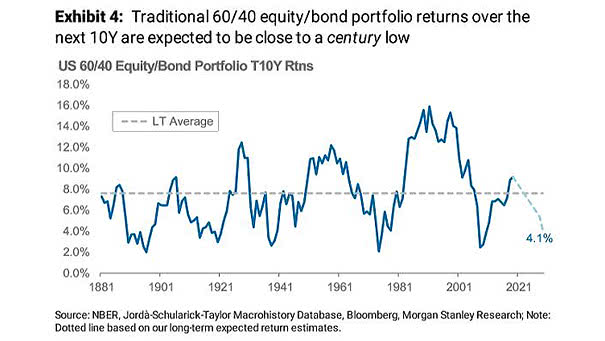
U.S. 60/40 Portfolio Returns Over the Next 10 Years Chart suggesting that the return of a U.S. 60/40 portfolio could slide near 100-year lows over the next decade, due to low yields, low growth and low inflation expectations. Image: Morgan Stanley Research
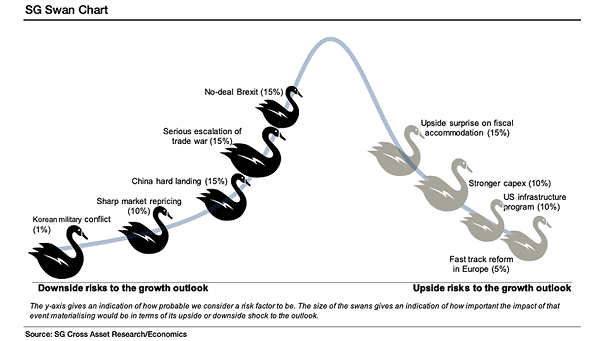
Upside and Downside Risks to the Growth Outlook – SG White & Black Swan Chart The SG swan chart shows upside and downside risks to growth forecasts on a one-year horizon. Image: Societe Generale Cross Asset Research