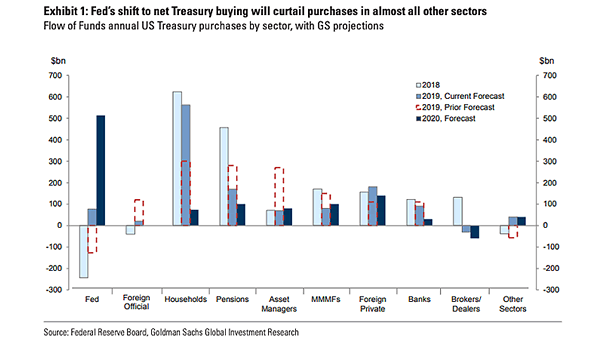
Global PMI and Real GDP

Global PMI and Real GDP Chart showing the correlation between global PMI and real GDP. Is the worst over for global PMI? Image: J.P. Morgan

Number of Listed Companies in the U.S.

Number of Listed Companies in the U.S. The U.S. stock market is shrinking. There are fewer firms listed on U.S. stock exchanges than 20 years ago. Image: Financial Times

200D Change in Yield Curve 30Y-10Y Leads U.S. ISM Manufacturing Index

200D Change in Yield Curve 30Y-10Y Leads U.S. ISM Manufacturing Index This great chart suggests that 200-Day Change in Yield Curve 30-Year minus 10-Year spread leads U.S. ISM Manufacturing Index by 16 months. It also suggests that U.S. PMI is probably bottoming now and could bounce back. Image: Fundstrat Global Advisors, LLC

S&P 500 Earnings Yield vs. 10-Year U.S. Treasury Yield

S&P 500 Earnings Yield vs. 10-Year U.S. Treasury Yield The gap between the S&P 500 earnings yield and the 10-year U.S. Treasury yield is currently relatively high. Image: Goldman Sachs Global Investment Research