Federal Reserve’s Balance Sheet
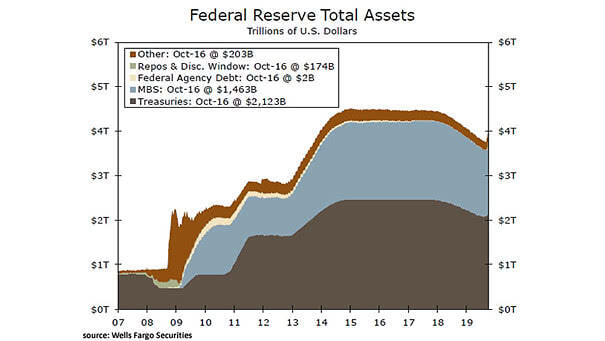
Federal Reserve’s Balance Sheet This chart shows the Federal Reserve total assets. According to the NY Fed, the Fed’s balance sheet could be between $3.8 trillion and $4.7 trillion by 2025. Image: Wells Fargo Securities, LLC