S&P 500 vs. IPO Performance
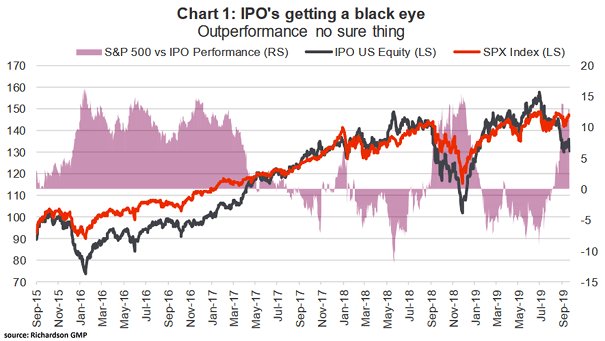
S&P 500 vs. IPO Performance The chart shows how IPOs have performed since 2015. Currently, investors seem reluctant to invest in high-risk, high-growth companies. Image: Richardson Wealth
S&P 500 vs. IPO Performance The chart shows how IPOs have performed since 2015. Currently, investors seem reluctant to invest in high-risk, high-growth companies. Image: Richardson Wealth
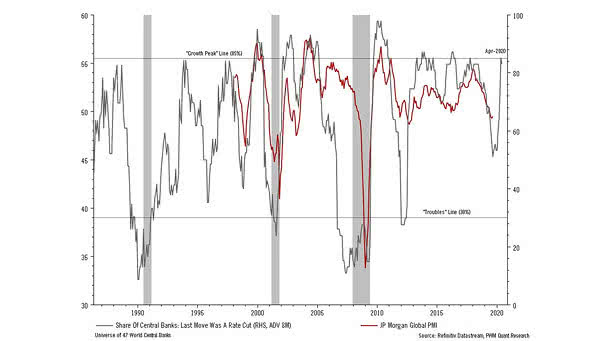
Central Bank Rate Cuts Lead Global Manufacturing PMI by 8 Months Charting suggesting that central banks rate cuts lead global manufacturing PMI by 8 months. Image: Pictet Wealth Management
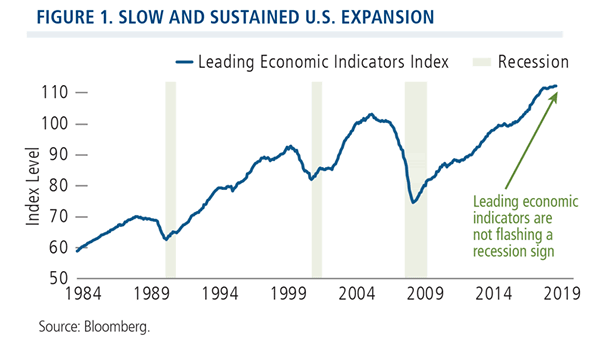
Leading Economic Index (LEI) for the U.S. and Recessions Leading economic indicators are still trending upward. The U.S. economy is growing, but more slowly. Image: Calamos Investments LLC
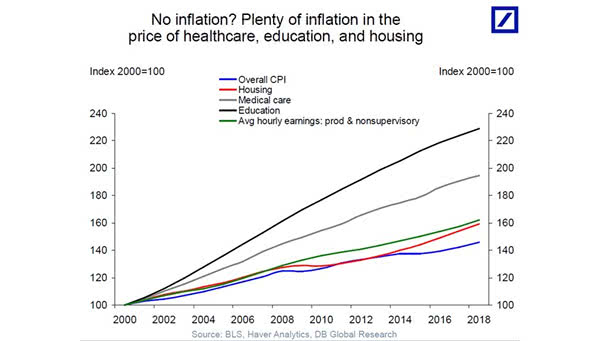
Inflation – Price Changes Since 2000 in the U.S. Headlines say there’s no inflation, but most important things in life are getting more expensive in the United States. Image: Deutsche Bank Global Research
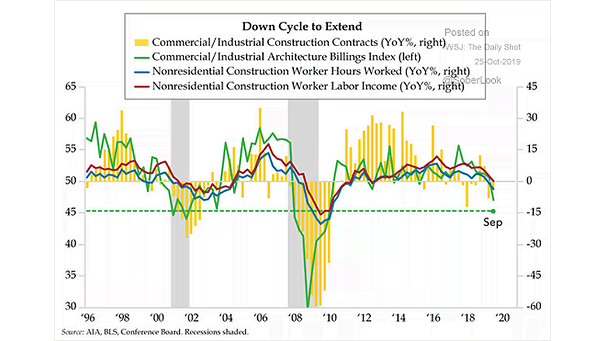
Construction Sector Activity and Recessions This chart clearly shows that growth of activity in the construction sector is slowing down. Image: Quill Intelligence, LLC
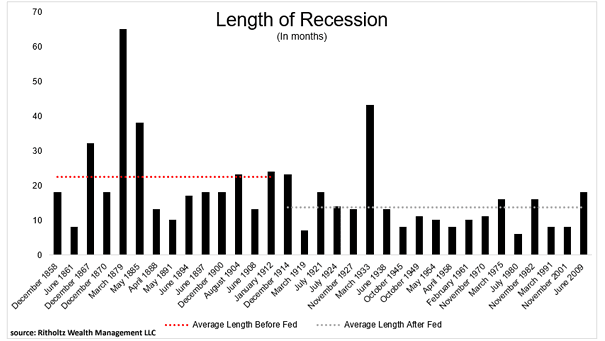
Length of U.S. Recessions This chart puts into perspective the length of U.S. recessions, before and after the Fed. Image: Ritholtz Wealth Management LLC
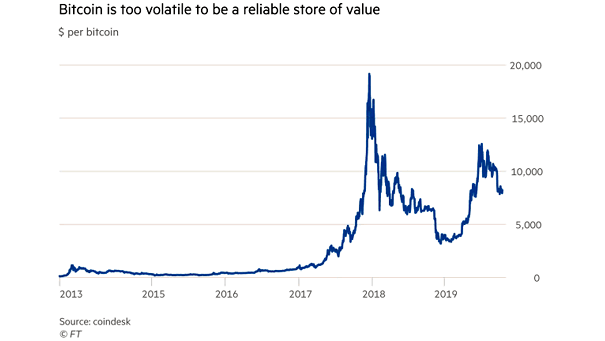
Bitcoin Volatility The price of Bitcoin exhibits high volatility persistence. Has Bitcoin failed as a means of payment and store of value? Image: Financial Times
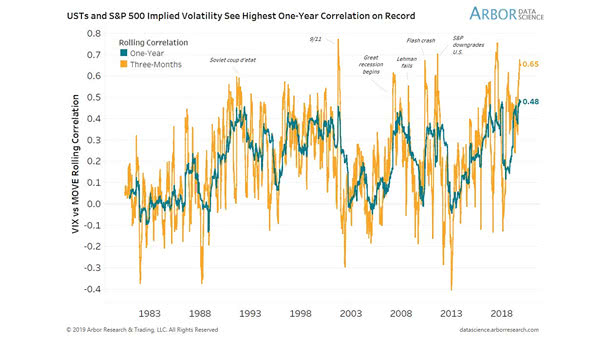
VIX and MOVE Rolling Correlation Periods of high correlation between safe and risk assets are generally not good for balanced portfolios, because diversification is hard to find. Image: Arbor Research & Trading LLC

Yield Curve and Banks A steeper yield curve helps banks to borrow more cheaply and lend at higher rates of interest. Image: Morgan Stanley
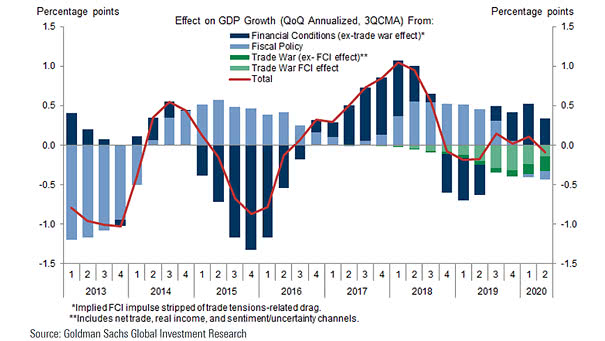
Effect on U.S. GDP Growth from Financial Conditions, Fiscal Policy and Trade War Financial Conditions should offset the effect of the trade war in 2020. Image: Goldman Sachs Global Investment Research
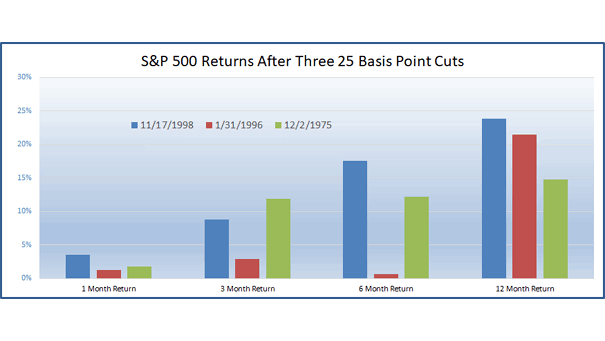
S&P 500 Returns After Three 25 Basis Point Rate Cuts Chart showing what the S&P 500 did after three rate cuts of 25 basis points in 1975, 1996 & 1998. Image: Ryan Detrick, LPL Financial LLC