S&P 500 Value Index at All-Time High
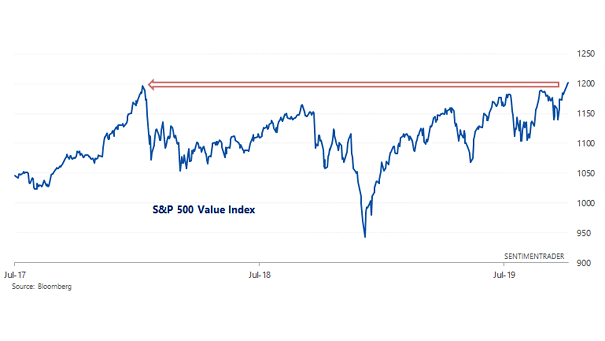
S&P 500 Value Index at All-Time High Historically, when the S&P 500 Value Index made a new all-time high for the first time in 200+ days, it went higher 6 months later. Image: Sentimentrader
S&P 500 Value Index at All-Time High Historically, when the S&P 500 Value Index made a new all-time high for the first time in 200+ days, it went higher 6 months later. Image: Sentimentrader
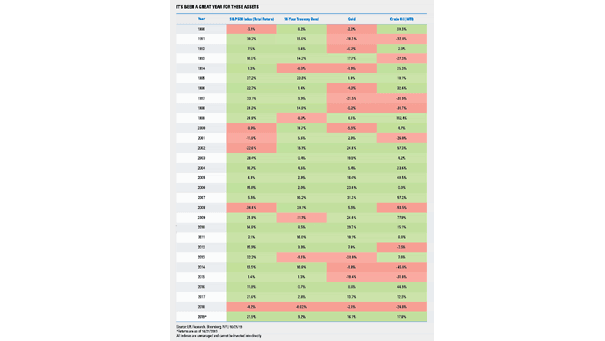
Asset Class Returns in YTD 2019 The S&P 500 Index, US Treasury bonds, gold and crude oil are all positive this year. This situation is quite rare. It never happened before, to have them all up double digits. Image: LPL Research
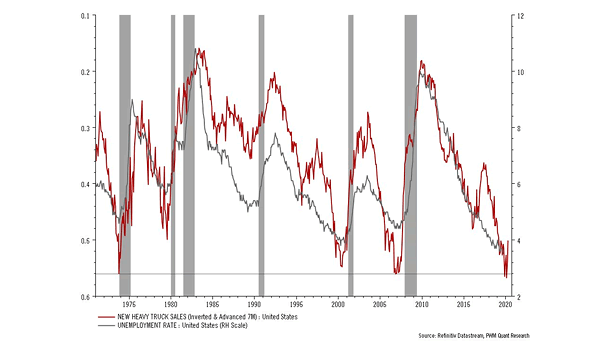
U.S. New Heavy Truck Sales Lead U.S. Unemployment Rate Chart suggesting that U.S. new heavy truck sales lead the U.S. unemployment rate by 7 months. Image: Pictet Wealth Management
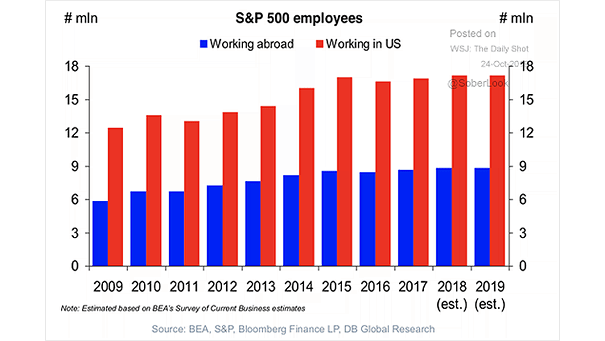
S&P 500 Employees Why S&P 500 companies aren’t so American? A large portion of S&P 500 employees works abroad. Image: Deutsche Bank Global Research
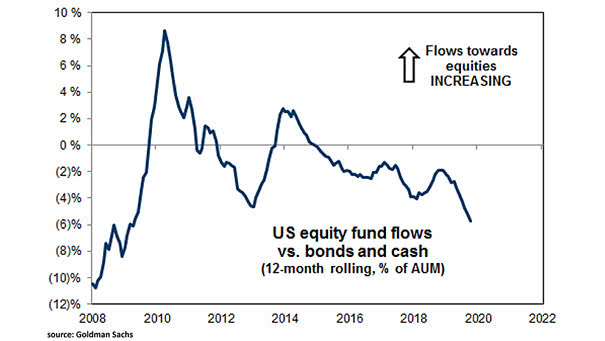
U.S. Equity Fund Flows vs. Bonds and Cash This chart puts into perspective the rotation from equities to bonds and cash, as investors become cautious about further growth. Image: Goldman Sachs Global Investment Research
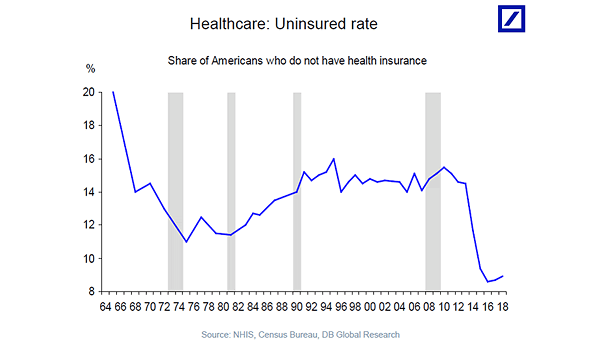
Health Care: Uninsured Rate Chart showing that the uninsured rate was down until the last year. Image: Deutsche Bank Global Research
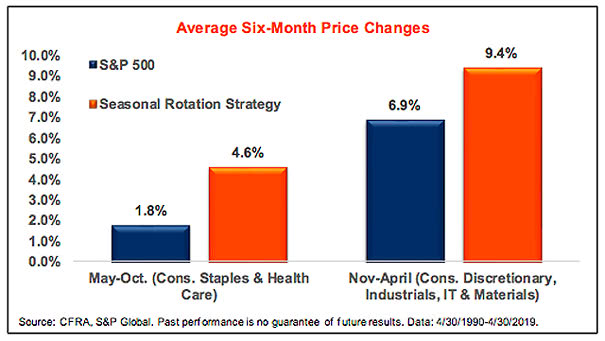
S&P 500 and Seasonal Rotation Strategy Sell in May and go away? This chart suggests that a rotation between defensive and cyclical sectors was a much better strategy Image: CFRA, S&P Global
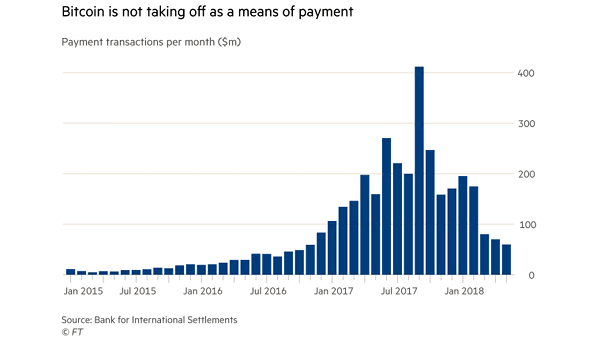
Bitcoin and Payment Transactions Per Month Is cryptocurrency overhyped? Today, Bitcoin is processing fewer payment transactions per month than in 2016. Image: Financial Times
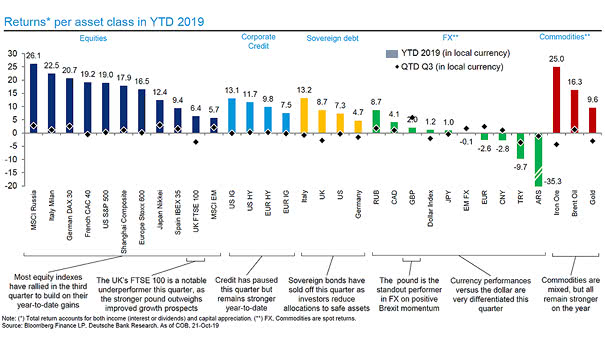
Returns Per Asset Class in YTD 2019 This chart shows what investors should have bought in 2019. Image: Deutsche Bank Global Research
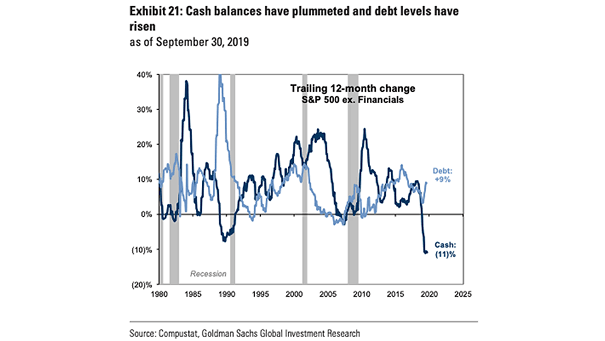
S&P 500 Cash Balances and Debt Levels During the past 12 months, non-financial S&P 500 cash balances have declined by -11% and debt levels have inflected higher by +9%. Image: Goldman Sachs Global Investment Research
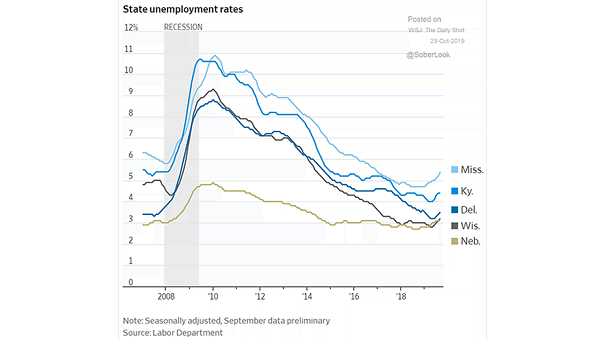
U.S. State Unemployment Rates The unemployment rate is increasing in some states. Image: The Wall Street Journal